
Natasha Awada, Paul La Rondie, Laurie Buchanan and, Jill Stevens Solutions for Chapter: From Approximation to Generalization: Integration, Exercise 26: Exercise 10J
Natasha Awada Mathematics Solutions for Exercise - Natasha Awada, Paul La Rondie, Laurie Buchanan and, Jill Stevens Solutions for Chapter: From Approximation to Generalization: Integration, Exercise 26: Exercise 10J
Attempt the practice questions on Chapter 10: From Approximation to Generalization: Integration, Exercise 26: Exercise 10J with hints and solutions to strengthen your understanding. Mathematics : Analysis and Approaches Standard Level Course Companion solutions are prepared by Experienced Embibe Experts.
Questions from Natasha Awada, Paul La Rondie, Laurie Buchanan and, Jill Stevens Solutions for Chapter: From Approximation to Generalization: Integration, Exercise 26: Exercise 10J with Hints & Solutions
Sketch the graph of the given functions on the same set of axes, and shade the region bound by the two curves. Write down an expression that gives the area of the region. Find the area using a GDC.
.
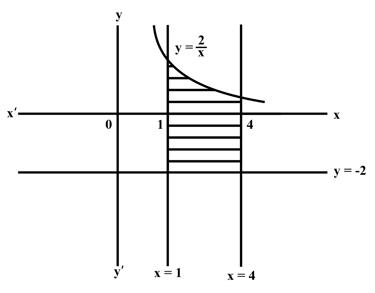
The diagram shows a shaded region, bounded by the curves and . The area of the region can be written in the form . Find the values of .
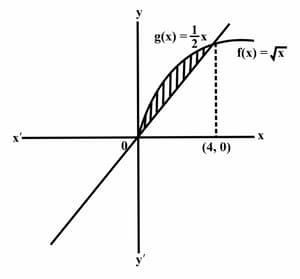
Consider the functions . Part of the graphs of are shown in the diagram. Find the coordinates of the points of intersection of the graphs of .

Consider the functions . Part of the graphs of are shown in the diagram. Write an integral expression for the area enclosed by the graph of .

Consider the functions . Part of the graphs of are shown in the diagram. Find the shaded region area.
Consider the functions . Part of the graphs of are shown in the diagram. The line divides the area of the region in half. Write down an integral expression for half the area of the region.
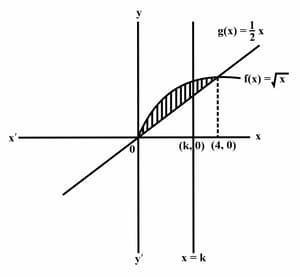
Consider the functions . Part of the graphs of are shown in the diagram. The line divides the area of the region in half. Find an expression, not involving an integral, for half the area of the region.
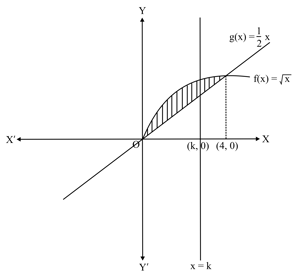
Consider the functions . Part of the graphs of are shown in the diagram. The line divides the area of the region in half. Using your GDC, find the value of .


