
Embibe Experts Solutions for Chapter: Data Handling, Exercise 1: Exercise
Embibe Experts Mathematics Solutions for Exercise - Embibe Experts Solutions for Chapter: Data Handling, Exercise 1: Exercise
Attempt the practice questions on Chapter 5: Data Handling, Exercise 1: Exercise with hints and solutions to strengthen your understanding. Mathematics Crash Course (Based on Revised Syllabus-2023) solutions are prepared by Experienced Embibe Experts.
Questions from Embibe Experts Solutions for Chapter: Data Handling, Exercise 1: Exercise with Hints & Solutions
In a given data the number of times a particular observation occurs is called its _____.
The following is the survey report of the weekly income of the families of a ward of a municipality:
| Income in Rupees | Number of families |
| and above | |
| and above | |
| and above | |
| and above | |
| and above | |
| and above | |
| and above | |
| and above | |
| and above | |
| and above | |
| and above | |
| and above | |
| and above | |
| and above | |
| and above |
From the above data construct a continuos frequency table and also find the cumulative frequency of each class. Further find the number of families whose weekly income is at the most .
The different expenditures incurred on the construction of a building were shown by a pie diagram. The expenditure on cement was shown by a sector of central angle . What was the total expenditure of the construction?
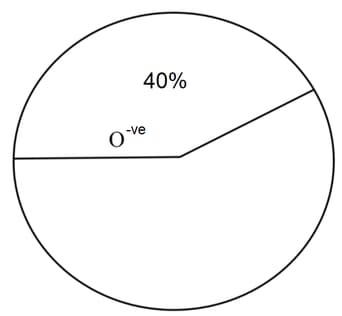
The people having blood group are . The classification of the people based on the blood groups is to be shown by a pie diagram. What should be the measure of angle for the people with blood group?
The given pie chart shows the monthly expenditure of a family on rent, clothing, food, savings and miscellaneous items. The family spends on miscellaneous items.
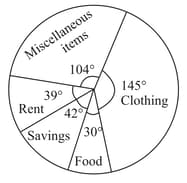
How much does the family spend on rent, food and clothing in a year, if the expenditure is the same throughout the year
The given pie chart shows the monthly expenditure of a family on rent, clothing, food, savings and miscellaneous items.
The family spends on miscellaneous items.
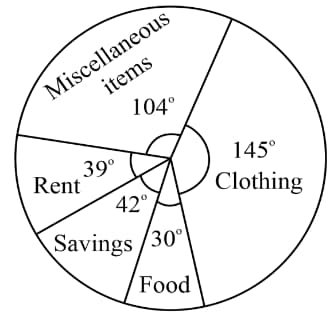
How much more does the family spend on clothing than on savings
The circle graph given in Figure shows the spending of a country on various sports during a particular year. Study the graph carefully and answer the following question.
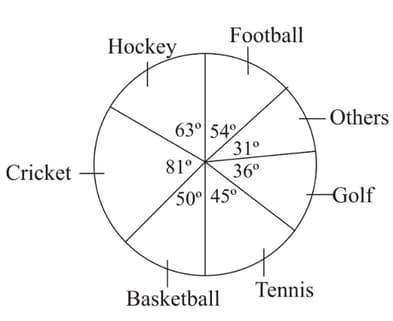
How much percent less is spent on football than on cricket?
A pie chart represents the monthly expenditure incurred by a student residing in a hostel. If the central angles representing the mess charges and college fees are and then the ratio of the expenditure incurred on mess to the expenditure incurred on college fees is


