
R. D. Sharma Solutions for Chapter: Data Handling-III (Bar Graphs), Exercise 1: EXERCISE
R. D. Sharma Mathematics Solutions for Exercise - R. D. Sharma Solutions for Chapter: Data Handling-III (Bar Graphs), Exercise 1: EXERCISE
Attempt the practice questions on Chapter 23: Data Handling-III (Bar Graphs), Exercise 1: EXERCISE with hints and solutions to strengthen your understanding. Mathematics for Class 6 solutions are prepared by Experienced Embibe Experts.
Questions from R. D. Sharma Solutions for Chapter: Data Handling-III (Bar Graphs), Exercise 1: EXERCISE with Hints & Solutions
Study the bar graph representing the number of persons in various age groups in a town shown in figure. Observe the bar graph and answer the question:
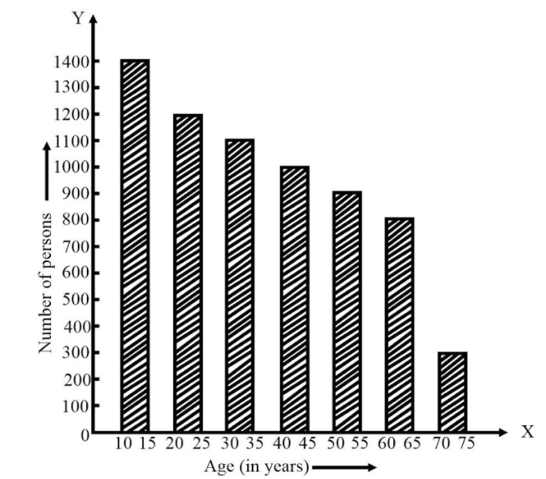
What is the age-group of exactly persons living in the town?
Study the bar graph representing the number of persons in various age groups in a town shown in figure.
What is the total number of persons living in the town in the age-group ?
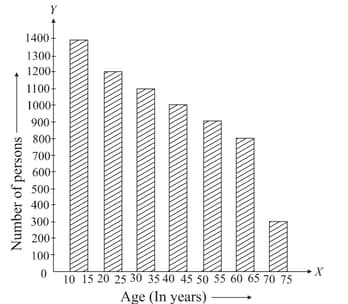
Study the bar graph representing the number of persons in various age groups in a town shown in Fig. Observe the bar graph and answer the following questions:
What is the total number of persons living in the town in the age-groups and ?
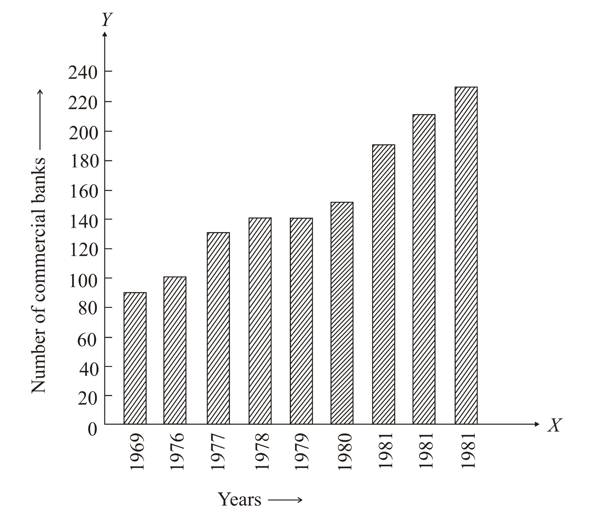
Read the bar graph shown in Fig. and answer the following question:
What was the number of commercial banks in ?
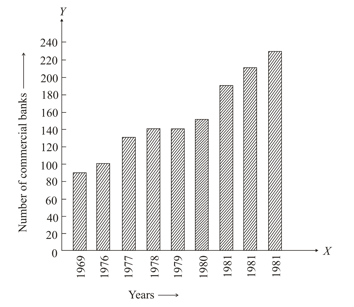
Read the bar graph shown in Figure below and answer the question:
What is the ratio of the number of commercial banks in to that in ?
This is the bar graph of the industrial production of cement in different years in India:
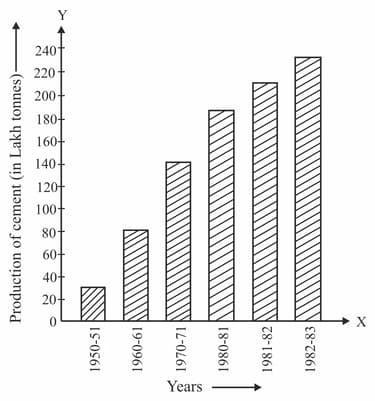
What was the production of cement in the year in lakh tonnes?
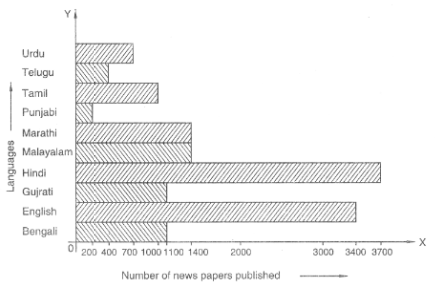
The above bar graph represents the circulation of newspapers in languages. What percent is the number of newspapers published in Hindi of the total number of newspapers?

The above bar graph represents the circulation of newspapers in languages. State the language in which the number of newspapers published is between and .


