
NCERT Solutions for Chapter: States of Matter, Exercise 1: Short Answer Type
NCERT Chemistry Solutions for Exercise - NCERT Solutions for Chapter: States of Matter, Exercise 1: Short Answer Type
Attempt the practice questions on Chapter 5: States of Matter, Exercise 1: Short Answer Type with hints and solutions to strengthen your understanding. NCERT Exemplar Chemistry - Class 11 solutions are prepared by Experienced Embibe Experts.
Questions from NCERT Solutions for Chapter: States of Matter, Exercise 1: Short Answer Type with Hints & Solutions
Name two phenomena that can be explained on the basis of surface tension.
Viscosity of a liquid arises due to strong intermolecular forces existing between the molecules. Stronger the intermolecular forces, greater is the viscosity. Name the intermolecular forces existing in the following liquids and arrange them in the increasing order of their viscosities. Also give reason for the assigned order in one line.
Water, hexane , glycerine
Explain the effect of increasing the temperature of a liquid, on intermolecular forces operating between its particles, what will happen to the viscosity of a liquid if its temperature is increased?
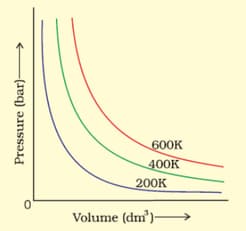
The variation of pressure with volume of the gas at different temperatures can be graphically represented as shown in the figure. On the basis of this graph, how will the volume of a gas change if its pressure is increased at constant temperature?
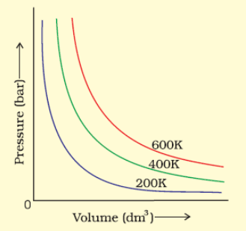
The variation of pressure with volume of the gas at different temperatures can be graphically represented as shown in the figure. On the basis of this graph, at constant pressure, how will the volume of a gas change if the temperature is increased from to ?
Pressure versus volume graph for a real gas and an ideal gas are shown in the figure. Answer the following question on the basis of this graph.
Interpret the behaviour of real gas with respect to ideal gas at low pressure.

Pressure versus volume graph for a real gas and an ideal gas are shown in the figure. Answer the following question on the basis of this graph. Interpret the behaviour of real gas with respect to ideal gas at high pressure.
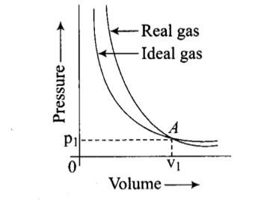
Pressure versus volume graph for a real gas and an ideal gas are shown in the figure. Answer the following question on the basis of this graph. Mark the pressure and volume by drawing a line at the point where real gas behaves as an ideal gas.


