Subject Experts Solutions for Chapter: Data Handling, Exercise 2: Worksheet 2
Subject Experts Mathematics Solutions for Exercise - Subject Experts Solutions for Chapter: Data Handling, Exercise 2: Worksheet 2
Attempt the practice questions on Chapter 5: Data Handling, Exercise 2: Worksheet 2 with hints and solutions to strengthen your understanding. NCERT Practice Workbook Mathematics solutions are prepared by Experienced Embibe Experts.
Questions from Subject Experts Solutions for Chapter: Data Handling, Exercise 2: Worksheet 2 with Hints & Solutions
Observe the given graph carefully and fill in the blank.
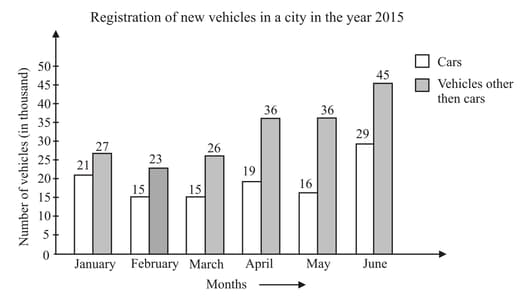
The increment in the number of vehicles other than cars from January to April, is _____.
Observe the given graph carefully and fill in the blank.
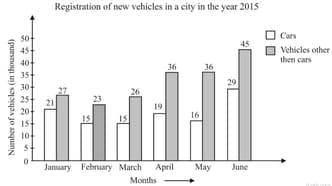
The difference between the number of cars registered in January to those registered in June, is _____.
Observe the given graph carefully and fill in the blank.
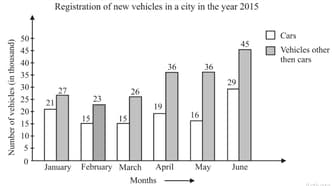
The month in which the registration of vehicles other than cars is maximum, is _____.
Draw a histogram for the frequency distribution of the marks obtained by students in mathematics as shown in the following table.
| Class interval | Frequency |
The following table represents the various professional course taken up by a batch of graduates of a college in the year .
| Course | MBA | Fashion designing | CA | B.ed | ICWA | MCA |
| Number of graduates |
Represent the information using bar graph as well as histogram.
The number of hours TV watched in a day by a students of a particular class during the holidays, is shown below.
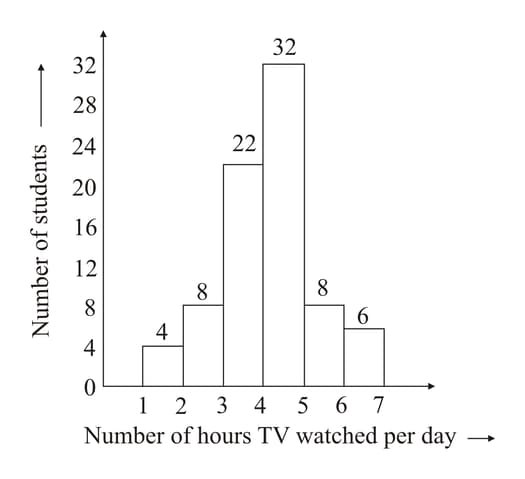
Observe the above Histogram and answer the following question.
For how many hours did maximum number of students watch TV?
The number of hours TV watched in a day by a students of a particular class during the holidays, is shown below.
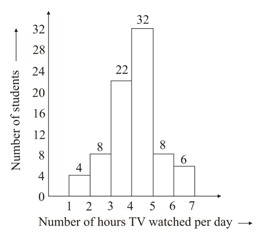
Observe the above Histogram and answer the given question.
How many students spend less than in watching TV?
The number of hours TV watched in a day by students of a particular class during the holidays, is shown below.
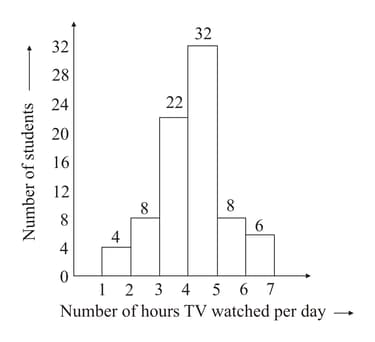
How many students spend more than in watching TV?
