
Subject Experts Solutions for Chapter: Data Handling, Exercise 3: Worksheet 3
Subject Experts Mathematics Solutions for Exercise - Subject Experts Solutions for Chapter: Data Handling, Exercise 3: Worksheet 3
Attempt the practice questions on Chapter 5: Data Handling, Exercise 3: Worksheet 3 with hints and solutions to strengthen your understanding. NCERT Practice Workbook Mathematics solutions are prepared by Experienced Embibe Experts.
Questions from Subject Experts Solutions for Chapter: Data Handling, Exercise 3: Worksheet 3 with Hints & Solutions
The following pie chart shows the different games played by the students of Class .
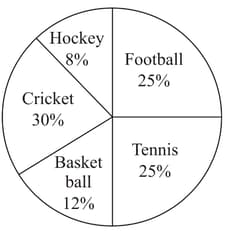
Observe the above pie chart and answer, the game played by least number of students is _____.
The following pie chart shows the different games played by the students of Class .
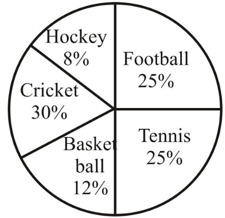
Observe the above pie chart and answer the question.(Cricket/Basketball/Tennis)
The game played by more number of students than hockey and less number of students than football, is _____.
On adding all the percentages in the given circle, we get sum as _____.
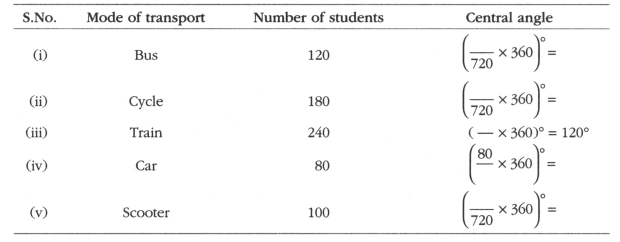
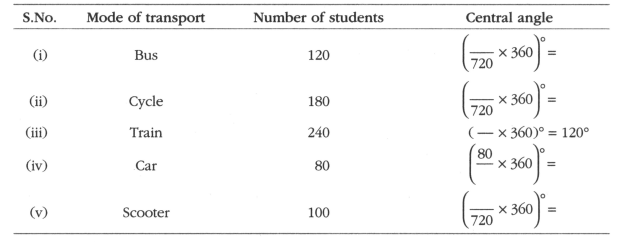
The data on the mode of transport used by students is given below.
Complete the following table and answer the questions that follow.
| S.No. | Mode of transport | Number of students | Central angle |
| (i) | Bus | ||
| (ii) | Cycle | ||
| (iii) | Train | ||
| (vi) | Car | ||
| (v) | Scooter |
What percentage of students use cycle as mode of transport?
The data on the mode of transport used by students is given below.
Complete the following table and answer the questions that follow.

Which mode of transport is used by the least number of students?. Also, find the percentage.
The data on the mode of transport used by students is given below.
Complete the following table and answer the questions that follow.
Find the ratio of percentage of least used mode of transport to the most used transport.
The data on the mode of transport used by students is given below.
Complete the following table and answer the questions that follow.
By how much percent are the bus users are more than the car users?
In the month of July , a householder spend a part of his monthly salary, amounting to , on different items as given below
| Items | Clothing | Food | Transport | Education | Other |
| Amount Spent (in ₹) |
Draw a pie-chart showing the above information.


