
Subject Experts Solutions for Chapter: Introduction to Graphs, Exercise 1: Worksheet 1
Subject Experts Mathematics Solutions for Exercise - Subject Experts Solutions for Chapter: Introduction to Graphs, Exercise 1: Worksheet 1
Attempt the practice questions on Chapter 15: Introduction to Graphs, Exercise 1: Worksheet 1 with hints and solutions to strengthen your understanding. NCERT Practice Workbook Mathematics solutions are prepared by Experienced Embibe Experts.
Questions from Subject Experts Solutions for Chapter: Introduction to Graphs, Exercise 1: Worksheet 1 with Hints & Solutions
Mr. Adam fell sick and his doctor maintained a record for his body temperature taken every four hours. It is shown in the given time-temperature graph.
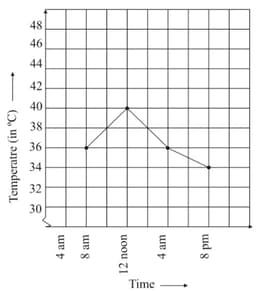
Observe the above and answer the given question.
At temperature was lowest. Find the value of
The following line graph describes the distance of a car from city to city , which are km apart.
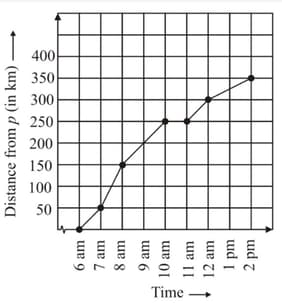
Observe the above graph and answer the following question.
At what time the car begins its journey?
The following line graph describes the distance of a car from city to city , which are apart.

Observe the above graph and answer the following questions.
How far did the car go in the first hour after starting its journey?
The following line graph describes the distance of a car from city to city , which are apart.

Observe the above graph and answer the following question.
How far did car go from the starting point to till the hour?
The following line graph describes the distance of a car from city to city , which are apart.

Observe the above graph and answer the following question.
At what time did the car reach at city ?
The following line graph shows the number of students appeared in an exam in different years.

Observe the above graph and answer, how many students appeared in the exam in the year ?
The following line graph shows the number of students appeared in an exam in different years.
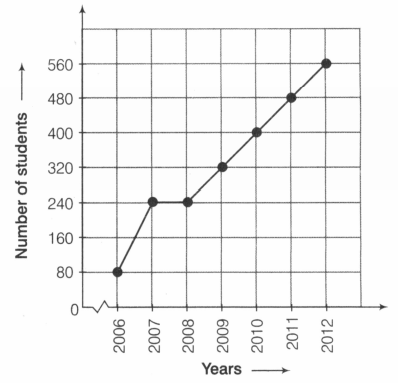
Observe the above graph and answer the following question.
The following line graph shows the number of students who appeared in an exam in different years.
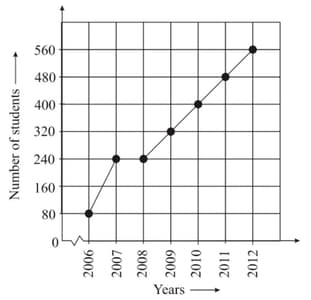
In which year did the maximum number of students appear in the exam?


