
O P Malhotra, S K Gupta and, Anubhuti Gangal Solutions for Chapter: Graphical Representation of Data, Exercise 1: Exercise
O P Malhotra Mathematics Solutions for Exercise - O P Malhotra, S K Gupta and, Anubhuti Gangal Solutions for Chapter: Graphical Representation of Data, Exercise 1: Exercise
Attempt the practice questions on Chapter 24: Graphical Representation of Data, Exercise 1: Exercise with hints and solutions to strengthen your understanding. New Mathematics Today Class 7 solutions are prepared by Experienced Embibe Experts.
Questions from O P Malhotra, S K Gupta and, Anubhuti Gangal Solutions for Chapter: Graphical Representation of Data, Exercise 1: Exercise with Hints & Solutions
The bar graph shows the average swimming speed for some common fish.
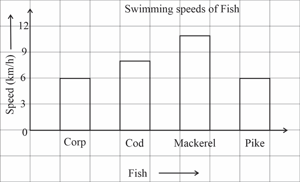
Which fish has the fastest average swimming speed?
The double bar graph given shows the results of a survey on sale of different ice cream flavours. Use it to answer the following questions.
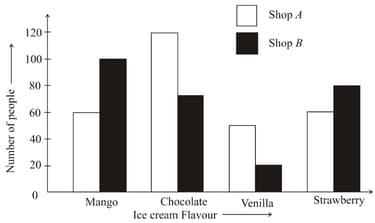
Which flavour of ice cream do people like most in Shop ?
The double bar graph given shows the results of a survey on the sale of different ice cream flavours. Which flavour of ice cream is liked the most in both the shops together?
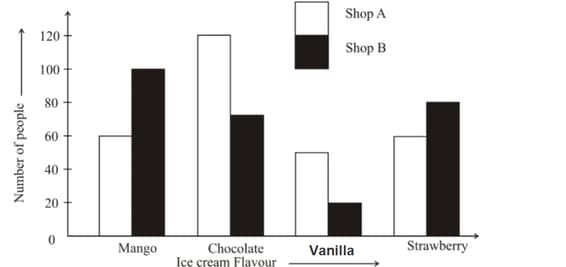
The double bar graph given shows the results of a survey on sale of different ice cream flavours. Use it to answer the following questions.
Express the sale of strawberry ice creams in shop as a percent of the total number of ice creams sold.
The double bar graph given shows the results of a survey on sale of different ice cream flavours. Use it to answer the following question.
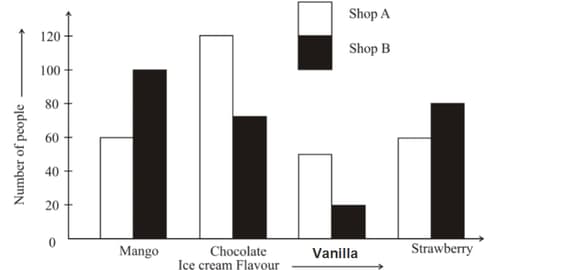
If shop sold 50 vanilla ice creams then find .
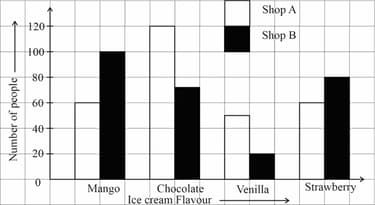
The double bar graph given shows the results of a survey on the sale of different ice cream flavours.
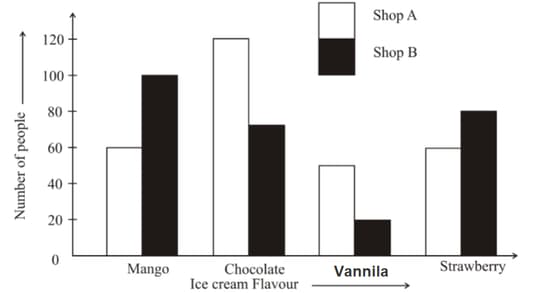
Find the ratio of the number of mango ice creams sold in shop to the number of vanilla ice creams sold in shop .
The line graph shows the temperature of a patient in a hospital, recorded every hour.
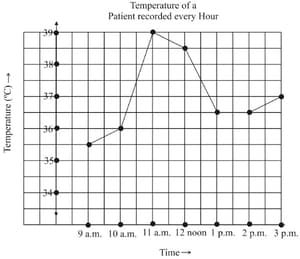
What was the patient’s temperature at ?
The line graph shows the temperature of a patient in a hospital, recorded every hour.
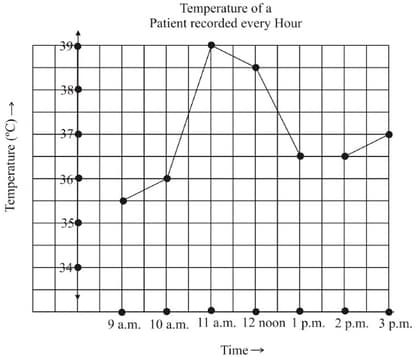
When was the patient’s temperature .


