O P Malhotra, S K Gupta and, Anubhuti Gangal Solutions for Chapter: Graphical Representation of Data, Exercise 2: Revision Exercise
O P Malhotra Mathematics Solutions for Exercise - O P Malhotra, S K Gupta and, Anubhuti Gangal Solutions for Chapter: Graphical Representation of Data, Exercise 2: Revision Exercise
Attempt the free practice questions on Chapter 24: Graphical Representation of Data, Exercise 2: Revision Exercise with hints and solutions to strengthen your understanding. New Mathematics Today Class 7 solutions are prepared by Experienced Embibe Experts.
Questions from O P Malhotra, S K Gupta and, Anubhuti Gangal Solutions for Chapter: Graphical Representation of Data, Exercise 2: Revision Exercise with Hints & Solutions
Given below is a double bar graph which shows the scores out of of five students in an Algebra Test with and without preparation.

Who has shown the maximum improvement?
Given below is a double bar graph which shows the scores (out of ) of five students in an Algebra Test with and without preparation. Look at the graph carefully and answer the questions that follow.
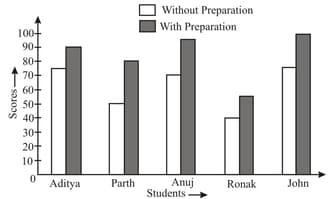
Calculate the percentage increase in Aditya’s score.
The pie-chart given here shows expenditure incurred by a family on various items and their savings, which amount to in a month. Study the chart.
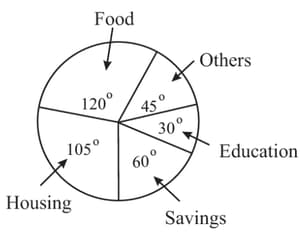
The total expenditure of the family for the month is
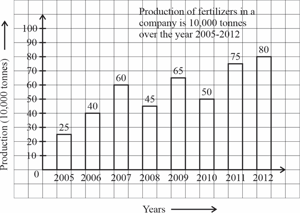
What was the percentage decline in the production of fertilizers from to ?
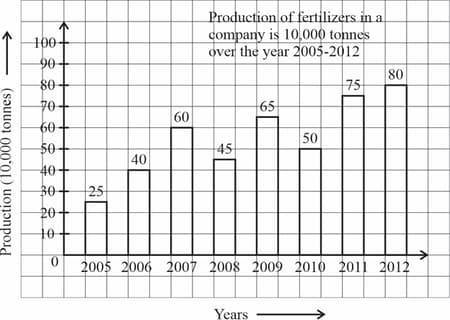
In how many years was the production of fertilizers more than the average production in the given years?
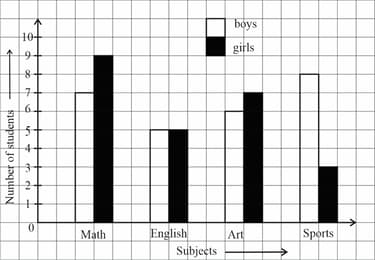
The graph given below shows the favourite subjects of boys and girls of grade of a school. Which subject was liked the most by both boys and girls?

The graph given below shows the favourite subjects of boys and girls of grade of a school.

Which subject do boys like more than the girls do?
The graph given below shows the favourite subjects of boys and girls of grade of a school. What is the percent of students liking English out of the whole class?