
Kerala Board Solutions for Chapter: Solutions, Exercise 5: Exercise 5
Kerala Board Science Solutions for Exercise - Kerala Board Solutions for Chapter: Solutions, Exercise 5: Exercise 5
Attempt the free practice questions on Chapter 4: Solutions, Exercise 5: Exercise 5 with hints and solutions to strengthen your understanding. Science for Class 8 - Part 2 solutions are prepared by Experienced Embibe Experts.
Questions from Kerala Board Solutions for Chapter: Solutions, Exercise 5: Exercise 5 with Hints & Solutions
While preparing saturated solutions of various solutes in a definite amount of a given solvent under the same conditions, will the amount of solutes getting dissolved be the same? Try to find out.
Given is a graph that connects the solubility and the temperature of certain salts.
Examine the graph and find out the following:

Which substance shows the maximum increase in solubility as temperature increases?
Given is a graph that connects the solubility and the temperature of certain salts.
Examine the graph and find out the following:

Which salts have the same solubility at a temperature of ?
Given is a graph that connects the solubility and the temperature of certain salts. Examine the graph and find out the following:
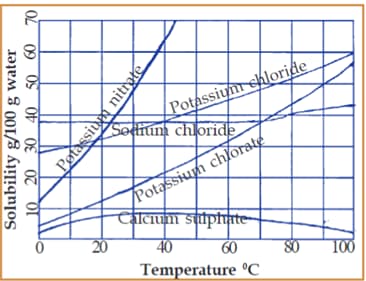
Which substance shows a decrease in solubility with an increase in temperature?
Given is a graph that connects the solubility and the temperature of certain salts. Examine the graph and find out the following:

Prepare a note on the influence of temperature on the solubility of substances. Give examples.


