
The following table shows the number of electric bulbs purchased for a lodging house during the first four months of a year.
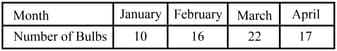
Represent it by a pictograph.
Important Questions on Data Handling
The table given below shows the number of students playing four different games.
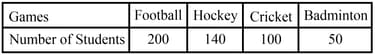
Present this information by a pictograph. You can use stickers to make the pictograph.
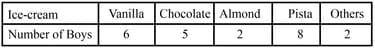
Draw a pictograph of following survey of the favourite ice-cream flavours of boys.
The sale of electric bulbs on different days of a shop in a week is shown alongside as a pictograph :

Observe the pictograph and answer the following questions :
How many bulbs were sold on Friday?
The sale of electric bulbs on different days of a shop in a week is shown alongside as a pictograph :

Observe the pictograph and answer the following questions :
On which day was the maximum number of bulbs sold?
The sale of electric bulbs on different days of a shop in a week is shown alongside as a pictograph :

Observe the pictograph and answer the following questions :
If one bulb was sold at the rate of , what was the total sale on Sunday?
The sale of electric bulbs on different days of a shop in a week is shown alongside as a pictograph :
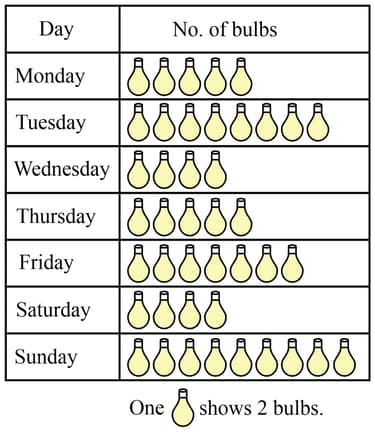
Observe the pictograph and answer the following questions :
Can you find out the total number of bulbs sold in the week?
The sale of electric bulbs on different days of a shop in a week is shown alongside as a pictograph :

Observe the pictograph and answer the following questions :
If one big carton could hold bulbs, how many cartons were needed to hold the total bulbs sold in the given week?
Total number of students of a school in different years in shown in the following table.
Prepare a pictograph of students using one symbol  to represent 100 students and answer the following questions.
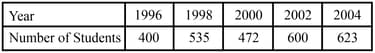
How many symbols represent the total number of students in the year 2002 ?


