
MEDIUM
JEE Main
IMPORTANT
Earn 100
A battery is connected to a uniform resistance wire and is earthed. Which one of the graphs below shows how the current density varies along ?
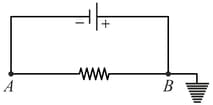
19.44% studentsanswered this correctly
Important Questions on Electric Current and Circuits
MEDIUM
JEE Main
IMPORTANT
Two wires each of radius of cross-section but of different materials are connected together end to end (i.e., in series). If the densities of charge carriers in the two wires are in the ratio , the drift velocity of electrons in the two wires will be in the ratio
MEDIUM
JEE Main
IMPORTANT
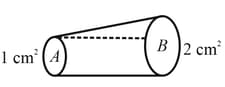
A solid conductor has a cross-section area and , as shown in the figure. A current of enters at . Then
MEDIUM
JEE Main
IMPORTANT
A long metal wire connects points and . The electric potential at point is less than that at point . If the conductivity of the metal is , then the magnitude of the current density in the wire is equal to:
MEDIUM
JEE Main
IMPORTANT
First, a set of equal resistors of each is connected in series to a battery of emf and internal resistance . A current is observed to flow. Then, the resistors are connected in parallel to the same battery. It is observed that the current is increased times. What is ?
MEDIUM
JEE Main
IMPORTANT
Suppose there is a circuit consisting of only resistances and batteries. Suppose one is to double (or increase it to times) all voltages and all resistances. Show that currents are unaltered.
MEDIUM
JEE Main
IMPORTANT
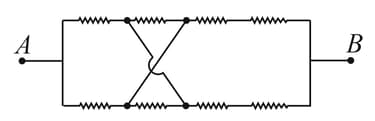
Find the equivalent resistance between terminals and . Each resistor is of resistance .
MEDIUM
JEE Main
IMPORTANT
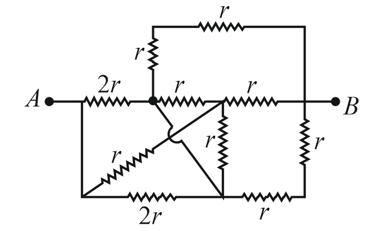
Find the equivalent resistance between and in the arrangement of resistances as shown.
MEDIUM
JEE Main
IMPORTANT
The two ends of a uniform conductor are joined to a cell of emf and some internal resistances. Starting from the midpoint of the conductor, we move in the direction of current and return to . The potential at every point on the path is plotted against the distance covered Which of the following graphs best represents the resulting curve?


