
A group of teachers were asked how many cups of coffee they drank in a typical day. The results are shown in this table. (Answer up to three decimal places)
Cups
Find the value of the mean for the given data.
Important Questions on Representing Data: Statistics for Univariate Data
Phil grows tomato plants in his garden. He records the number of tomatoes on each plant, and presents his data using this table.
| Tomatoes | ||||||||
How many tomato plants did Phil have in total?
Phil grows tomato plants in his garden. He records the number of tomatoes on each plant, and presents his data using this table.
| Tomatoes | ||||||||
What is the modal number of tomatoes per plant?
Phil grows tomato plants in his garden. He records the number of tomatoes on each plant, and presents his data using this table.
| Tomatoes | ||||||||
What is the mean number of tomatoes per plant?
Noot records the number of fish that she catches each day throughout the month of January. What is the mean number of fish that she catches per day?[Answer up to decimal places]
| Fish | |||||||||||
Mo works as a barista in a coffee shop and records the total amount, per day, that he receives in tips.[Answer up to decimal places]
| Tip | |
The bar chart shows the number of children per family in a selection of families.
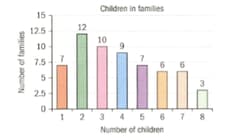
How many families are represented?
The bar chart shows the number of children per family in a selection of families.

Describe the skew.
The bar chart shows the number of children per family in a selection of families.

Write down the mode of the distribution.


