
A list is prepared which shows the marks obtained by students. Let's write down these marks by giving tally marks and prepare a frequency distribution chart.
.
Important Questions on Data Handling and Analysis
In Jahanara's school classes were held for only days this month. The number of students attending classes on these days are given below:
Using the above raw data, let's prepare a frequency distribution chart with tally marks.
Given below is the data showing which fruits friends like to have. Lets draw a bar graph based on this data.
| Fruits | Apple | Guava | Banana | Cucumber | Grapes |
| No. of friends |
Below is the weight of students of class of Soham's school.
Using the above raw data, let's prepare a frequency distribution chart.
From a survey conducted on students in a school, it is seen how many students like to study what subject. The raw data from the survey is given below:
| Subject | No. of students |
| Bengali | |
| Maths | |
| English | |
| Environment | |
| Hand Work |
Taking students, let's prepare a bar diagram.
Ram Da has a shop selling bags in Haldar Para. Ram Da himself makes the bags. Here a list of bags sold from the shop this week.
| Day | Monday | Tuesday | Wednesday | Thursday | Friday | Saturday |
| No. of bags sell. |
Draw a bar diagram.
A bar diagram shows the numbers of students appearing at the Madhaymik Examination each year during the last years.
Answer the below question by using the bar diagram.
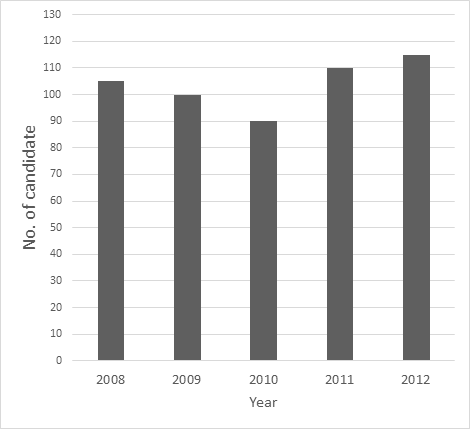
Determine in which year the maximum number of students have appeared for the exam?
A bar diagram shows the numbers of students appearing at the Madhymik Examination each year during the last years.
Answer the below question by using the bar diagram.

In which year the least number of students have sat for the exam?
A bar diagram shows the numbers of students appearing at the Madhymik Examination each year during the last years.
Answer the below question by using the bar diagram.

How many more students have appeared for the examination in than ?


