
A survey gave the results shown in the given table for a species of the Red Sea anemone, Actinia tenebrosa, on a rocky shore in New Zealand, using a quadrat with an area of 0.25m2.
Ouadrat
1
2
3
4
5
6
7
8
9
10
Number of red sea anemones
0
3
0
1
0
0
5
2
0
1
Calculate i) the species frequency and ii) the species density of A.tenebrosa from the results of this survey.
Important Questions on Classification Biodiversity and Conversation
A survey gave the results shown in the given table for a species of the Red Sea anemone, Isactinia tenebrosa, on a rocky shore in New Zealand, using a quadrat with an area of 0.25m2.
| Ouadrat | 1 | 2 | 3 | 4 | 5 | 6 | 7 | 8 | 9 | 10 |
| Number of red sea anemones | 0 | 3 | 0 | 1 | 0 | 0 | 5 | 2 | 0 | 1 |
Suggest when it might be more appropriate to use species frequency rather than species density to record the abundance of a species.
A survey was made of the Bengal dayflower Commelina benghalensis, growing on a lawn and in a field of young soybean plants. Ten 1.0 m2 quadrats were placed randomly in each area and the number of dayflower plants in each quadrat was counted. The results are shown in the given table:
| Ouadrat | 1 | 2 | 3 | 4 | 5 | 6 | 7 | 8 | 9 | 10 |
| Number od dayflowers on lawn | 0 | 0 | 4 | 3 | 0 | 1 | 2 | 4 | 0 | 3 |
| Number of dayflowers in field | 0 | 0 | 0 | 2 | 5 | 0 | 0 | 1 | 0 | 0 |
Calculate the species frequency and species density of dayflower plants in each of the two areas.
A survey was made of the Bengal dayflower Commelina benghalensis, growing on a lawn and in a field of young soybean plants. Ten 1.0 m2 quadrats were placed randomly in each area and the number of dayflower plants in each quadrat was counted. The results are shown in the given table: Calculate the species frequency and species density of dayflower plants in each of the two areas.
| Ouadrat | 1 | 2 | 3 | 4 | 5 | 6 | 7 | 8 | 9 | 10 |
| Number of dayflowers on lawn | 0 | 0 | 4 | 3 | 0 | 1 | 2 | 4 | 0 | 3 |
| Number of daylfowers in field | 0 | 0 | 0 | 2 | 5 | 0 | 0 | 1 | 0 | 0 |
Explain why it is important to use randomly placed quadrats for this survey?
A survey was made of the Bengal dayflower Commelina benghalensis, growing on a lawn and in a field of young soybean plants. Ten 1.0 m2 quadrats were placed randomly in each area and the number of dayflower plants in each quadrat was counted. The results are shown in the given table:
| Ouadrat | 1 | 2 | 3 | 4 | 5 | 6 | 7 | 8 | 9 | 10 |
| Number of dayflowers on lawn | 0 | 0 | 4 | 3 | 0 | 1 | 2 | 4 | 0 | 3 |
| Number of daylfowers in field | 0 | 0 | 0 | 2 | 5 | 0 | 0 | 1 | 0 | 0 |
Suggest two disadvantages with calculating percentage cover or using an abundance scale such as The Braun-Blanquet scale.
A sample was made of the animals on two rocky shores. Ten Quadrats were placed on each shore, and the number of animals of each species in each quadrat was counted.
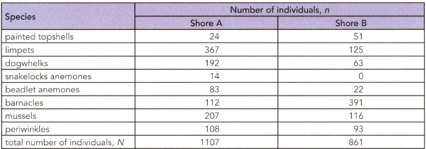
Calculate the D (Simpson’s Diversity Index) for Shore B by using the results given in the table.
A sample was made of the animals on two rocky shores. Ten Quadrants were placed on each shore, and the number of animals of each species in each quadrant was counted.

The Simpsons diversity Index of Shore A is 0.80 and the diversity of Shore B is 0.73. Compare the diversity of two shores.
In a survey of trees in a dry tropical forest. Some students identified five tree species (A to E). They counted the numbers of trees in an area 100m * 1oo m. Their results are as follows:
A 56 B 48 C 12 D 6 E 3
Calculate the Simpson’s index for the trees within the area sampled.


