
Ayush went to a stationery store and picked up the following items::
Items:
Notebooks
Ball Pens
Erasers
Geometry Boxes
Chart Papers
Numbers:
Represent the data in the form of a pictograph.
Important Questions on Data Handling
The following task shows the number of patients who visited an OPD of a city hospital during a particular week.
| Days: | Monday | Tuesday | Wednesday | Thursday | Friday | Saturday |
| Number of Patients: |
Draw a bar graph to represent the above data and answer the following question:
On which day did the maximum number of patients visit the hospital?
The following task shows the number of patients who visited an OPD of a city hospital during a particular week:
| Days: | Monday | Tuesday | Wednesday | Thursday | Friday | Saturday |
| Number of Patients: |
Draw a bar graph to represent the above data and answer the following question:
On which day did the minimum number of patients visit the hospital?
The following task shows the number of patients who visited an OPD of a city hospital during a particular week:
| Days | Monday | Tuesday | Wednesday | Thursday | Friday | Saturday |
| Number of Patients: | 300 | 240 | 180 | 150 | 250 | 270 |
Draw a bar graph to represent the above data and answer the following question:
How many patients visited on Tuesday?
The birth rate per thousand in five countries over a period of time is given below:
| Country: | China | India | Sweden | England | Germany |
| Birth Rate: |
Draw a bar graph to represent the above data.
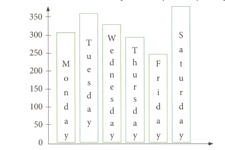
The bar graph below shows the number of bulbs produced by a factory during certain week.

Answer the following question:
On which day were the minimum number of bulbs produced?
The bar graph below shows the number of bulbs produced by a factory during certain week.

Answer the following question:
On which days were an equal number of bulbs produced?
The bar graph below shows the number of bulbs produced by a factory during certain week.
“Note: This question given in the book seems to have error and the modified question should be as given below.” (insufficient data)
The bar graph below shows the number of bulbs produced by a factory during certain week.
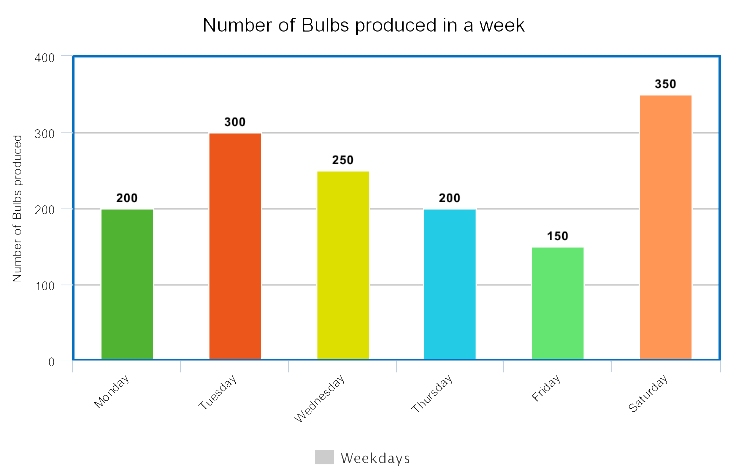
Answer the following question:
What is the total number of bulbs produced during the week?
The bar graph below shows the number of bulbs produced by a factory during certain week.
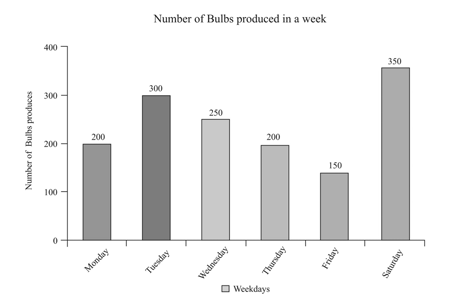
Answer the following question:
On which day were the maximum number of bulbs produced?


