
Direction: The given histogram represents the frequency distribution of average runs scored by selected players from a district in a local cricket tournament.
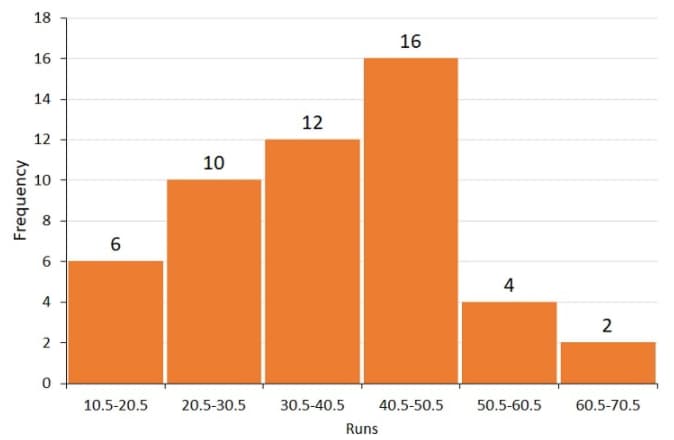
What is the overall average score of the players?
Important Questions on Data Interpretation
Direction: The given histogram represents the frequency distribution of average runs scored by selected players from a district in a local cricket tournament.
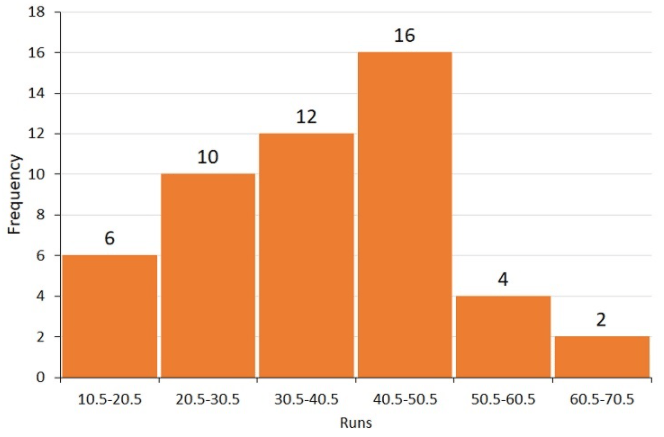
Which class of boundaries does the frequency of ‘’ correspond to?
Study the graph and answer the question.
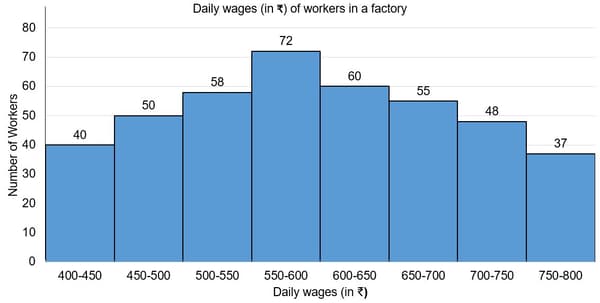
The number of workers in the factory whose daily wages are or more but less than is what percentage more than the number of workers whose daily wages are or more but less than (Your answer should be correct to one decimal place.)
The given histogram shows the height of the students.
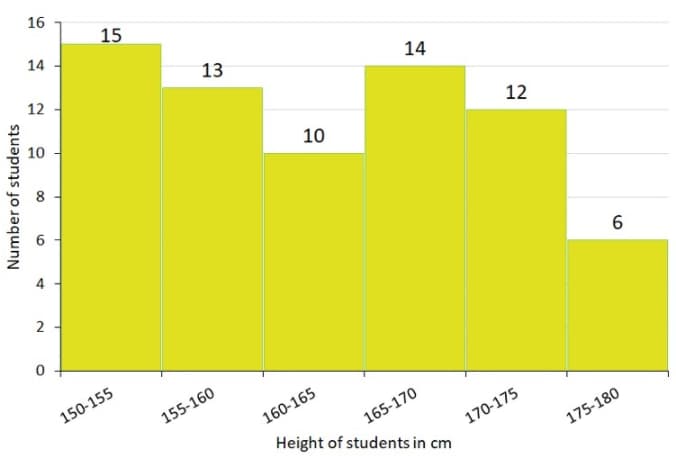
What is the percentage of students whose height is in the class interval ? (correct to the nearest integer)
The given histogram shows the frequency distribution of the speed of cars passing through at a particular spot on a highway. Study the graph and answer the question that follows.
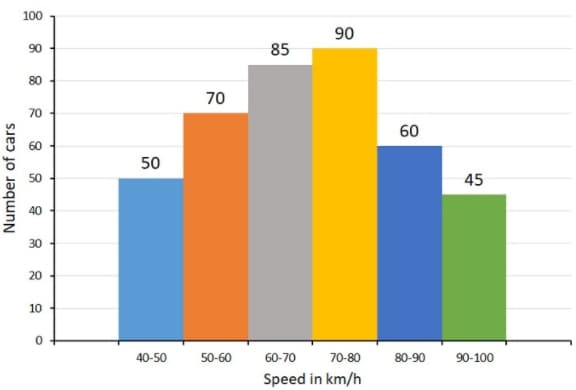
The number of cars with speed between and is what percentage more than the number of the cars with speed between and ? (correct to one decimal place)
The given histogram shows the frequency distribution of the speed of cars passing through at a particular spot on a highway. Study the graph and answer the question that follows.

What is the ratio of the number of cars with speed less than to the number of cars with speed more than ?
The given bar graph shows the number of students of two schools over a period of six years.
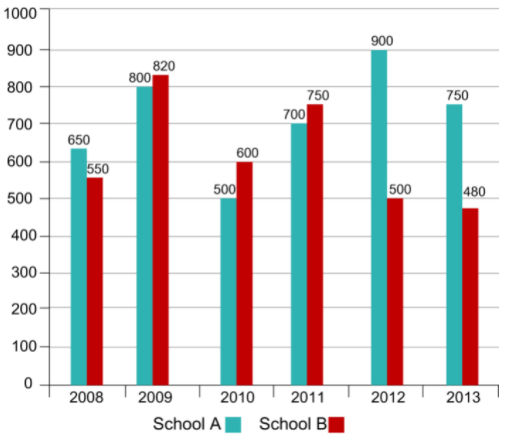
In the bar graph, what is the ratio of students taken for the years together from school A to the students taken for the years together from school B?
The given pie-chart represents the popularity of ice-cream flavours in the year .
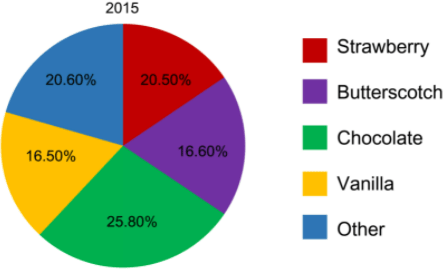
In , if the total sale of chocolate flavour is for , then the total sale (in ) for vanilla flavour is:
The given pie-chart represents the popularity of ice-cream flavour in the year .
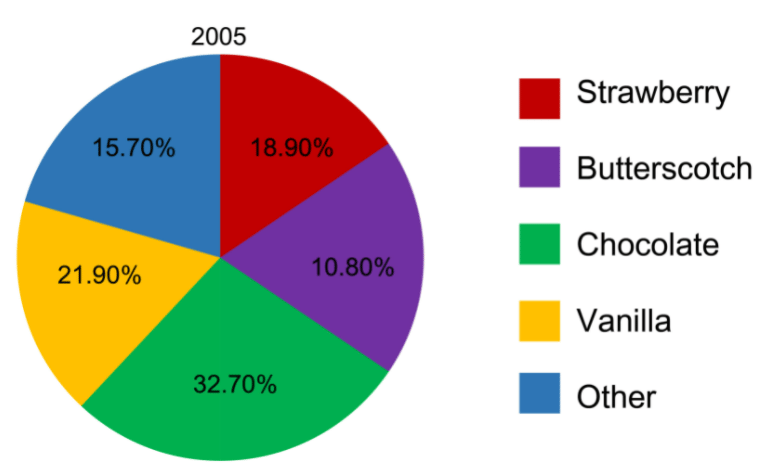
In , if of the 'other' category is mix fruit flavour and people surveyed preferred mix fruit flavour, then how many people were surveyed?


