
Draw a box-and-whisker plot for this data:
Minimum
First quartile
Median
Third quartile
Maximum
Important Questions on Representing Data: Statistics for Univariate Data
Mario conducted a science experiment to see how many minutes it took cups of ice to turn into water in the classroom.
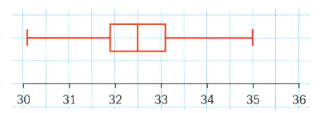
What was the minimum time?
Mario conducted a science experiment to see how many minutes it took cups of ice to turn into water in the classroom.

What was the maximum time?
Mario conducted a science experiment to see how many minutes it took cups of ice to turn into water in the classroom.

What was the median time?
Mario conducted a science experiment to see how many minutes it took cups of ice to turn into water in the classroom.
What was the interquartile range of the times?
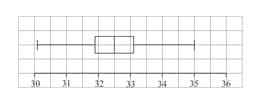
The number of students in international schools in the country of Portmany is shown below.
Show this information as a box-and whisker plot.
The number of students in international schools in the country of Portmany is shown below.
Show that is an outlier.
The number of students in international schools in the country of Portmany is shown below.
Given that is an outlier. Remove the outlier and redraw the box plot.
The number of students in international schools in the country of Portmany is shown below.
Given that is an outlier. State a reason to remove the outlier.


