
Draw a double bar graph for the following data. Birth and Death rates of different states in .
State
Birth Rate (Per )
Death Rate (Per )
Andhra Pradesh
Karnataka
Tamil Nadu
Kerala
Maharashtra
Orissa
Source: The table is taken from vital statistics SRS .
Important Questions on Data Handling
Draw a Pie chart for the following data. Time spent by a child during a day:
| Time spent for | Sleep | School | Play | Others |
| Time spent | hours | hours | hours | hours |
The adjoining pie chart gives the expenditure on various items during a month for a family. (The numbers written around the pie chart tell us the angles made by each sector at the centre.)

Answer the following: On which item is the expenditure minimum?
The adjoining pie chart gives the expenditure on various items during a month for a family. (The numbers written in the pie chart tell us the angles made by each sector at the centre.)
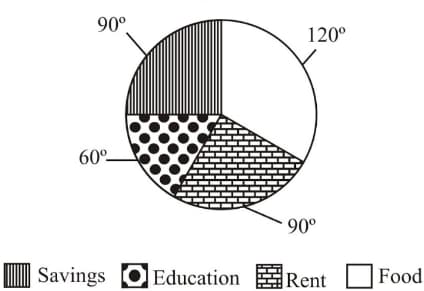
Answer the following: On which item is the expenditure maximum?
The adjoining pie chart gives the expenditure on various items during a month for a family. (The numbers written in the pie chart tell us the angles made by each sector at the centre.)

Answer the following: If the monthly income of the family is , what is the expenditure on rent?
The adjoining pie chart gives the expenditure on various items during a month for a family. (The numbers written around the pie chart tell us the angles made by each sector at the centre.)
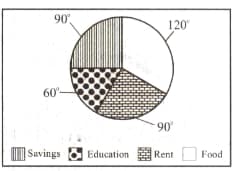
Answer the following: If the expenditure on food is , what is the expenditure on education of children?


