
Draw a histogram of the following data:
Important Questions on Data Handling-II (Graphical Representation of Data as Histograms)
Number of workshops organized by a school in different areas during the last five years are as follows:
Draw a histogram representing the above data.
Draw the histogram of the frequency distribution (taking one of the class intervals as
Construct a histogram for the following data:
Draw a histogram for the daily earnings of drug stores in the following table:
Draw a histogram to represent the following data:
The following histogram shows the number of literate females in the age group of to years in a town:
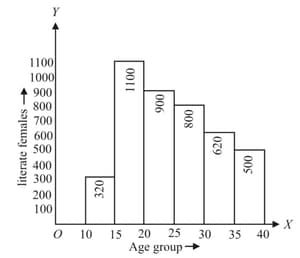
Write the age group in which the number of literate female is the highest.
The following histogram shows the number of literate females in the age group of to years in a town:
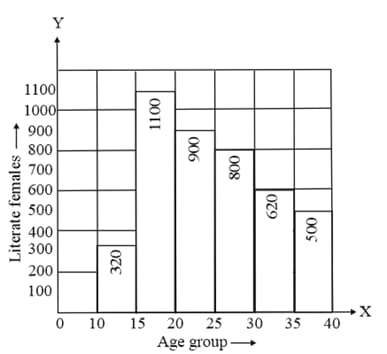
What is the class width?
The following histogram shows the number of literate females in the age group of to years in a town:
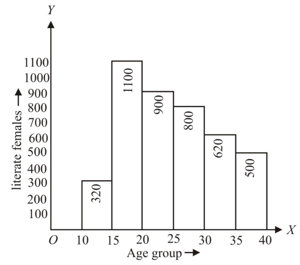
What is the lowest frequency?


