
Draw a histogram to represent the following data of the heights of boys of a school:
Height (in cm)
No. of boys
18
Important Questions on Histogram, Pie Chart and Line Graph
The following is the distribution of weights (in kg) of persons:
|
Weight (in kg) |
||||||
| No. of persons |
Draw a histogram for the above data and answer the following questions:
Which is the group with maximum number of persons?
The following is the distribution of weights (in kg) of 50 persons:
|
Weight (in kg) |
||||||
| No. of persons |
|
Draw a histogram for the above data and answer the following questions:
What is the class size?
The following is the distribution of weights (in kg) of persons:
|
Weight (in kg) |
||||||
| No. of persons |
Draw a histogram for the above data and answer the following questions:
Which is the group with minimum number of persons?
The given histogram depicts the earnings of 70 chemists.
Study the histogram and answer the following question:

What is the class size?
The given histogram depicts the earnings of chemists.
Study the histogram and answer the following questions:
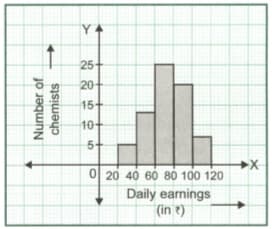
Which is the group with maximum earnings?
The given histogram depicts the earnings of chemists.
Study the histogram and answer the following questions:

The given histogram depicts the earnings of 70 chemists.
Study the histogram and answer the following questions:
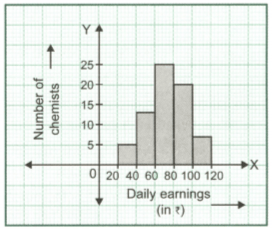
Study the given histogram and answer the questions that follow.
What informatiom is depicted in the above histogram?


