
Explain the advantage of using Simpson’s index of diversity rather than a species list as a way to represent the biodiversity of an area.
Important Questions on Classification Biodiversity and Conversation
In a survey of trees in a dry tropical forest. Some students identified five tree species (A to E). They counted the numbers of trees in an area 100 m * 100 m. Their results are as follows:
| Species | No. of individuals |
| A | 56 |
| B | 48 |
| C | 12 |
| D | 6 |
| E | 3 |
Looking at table write a set of instructions for making a kite diagram
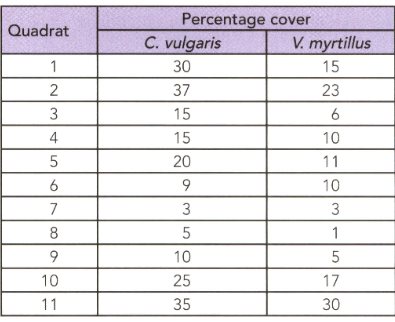
An ecologist studied two species in an area and his observation are shown in the given table.

Draw a scatter graph to show the data in the table.
An ecologist studied two species in an area and his observation are shown in the given table.

Calculate Spearman's correlation coefficient for the data in this table.
An ecologist studied two species in an area and his observation are shown in the given table.

Calculate Spearman's correlation coefficient for the data in this table. Why the the ecologist was able to reject the null hypothesis.
An ecologist studied two species in an area and his observation are shown in the given table.

Calculate Spearman's correlation coefficient for the data in this table. State the conclusion that the ecologist can make from this investigation.
An ecologist studied two species in an area and his observation are shown in the given table.
The ecologist think that this relationship is due to habitat preference that both species prefer dry soil. Describe an investigation that he could carry out to test this hypothesis.
| Number of tree | Circumference of tree/metres | Mean width of crack/mm |
| 1 | 1.77 | 50 |
| 2 | 1.65 | 28 |
| 3 | 1.81 | 60 |
| 4 | 0.89 | 24 |
| 5 | 1.97 | 95 |
| 6 | 2.15 | 51 |
| 7 | 0.18 | 2 |
| 8 | 0.46 | 15 |
| 9 | 2.11 | 69 |
| 10 | 2.00 | 64 |
| 11 | 2.42 | 74 |
| 12 | 1.89 | 69 |
Draw a scatter graph of the data given in the table.


