
Figure, shows part of the energy level diagram for the electrons in an imaginary atom. The arrows represent three transitions between the energy levels. For each of these transitions:
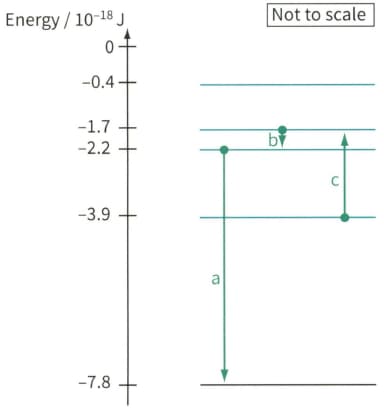
Electron energy level diagram, showing three electron transitions a, b and c.
State whether the transition contributes to an emission line in the spectrum or an absorption line in the spectrum.
Important Questions on Quantum Physics
Figure 28.20 shows another energy level diagram. In this case, energy is given in electronvolts (eV). The list shows the energies of some photons: . State and explain which of these photons will be absorbed by the electrons.
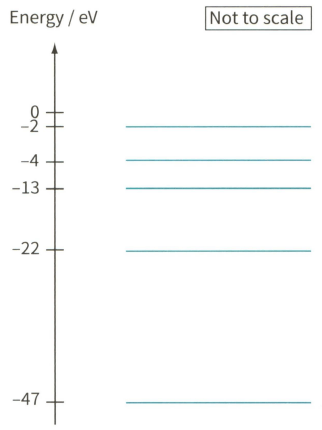
An energy level diagram.
The line spectrum for a particular type of atom is found to include the following wavelengths: . Calculate the corresponding photon energies in eV.
The line spectrum for a particular type of atom is found to include the following wavelengths: 83 nm 50 nm 25 nm.
(b) Sketch the energy levels that could give rise to these photons. On the diagram, indicate the corresponding electron transitions responsible for these three spectral lines.
X-rays are used to find out about the spacings of atomic planes in crystalline materials. Describe how beams of electrons could be used for the same purpose.
X-rays are used to find out about the spacings of atomic planes in crystalline materials. How might electron diffraction be used to identify a sample of a metal?
A beam of electrons is accelerated from rest through a p.d. of . What is the energy (in eV) of each electron in the beam?
A beam of electrons is accelerated from rest through a p.d. of .
Calculate the speed, and hence the momentum , of each electron.
A beam of electrons is accelerated from rest through a p.d. of .
(c) Calculate the de Broglie wavelength of each electron.


