
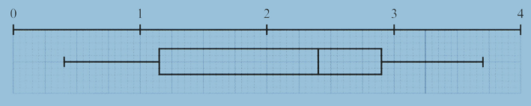
Find the range and the interquartile range of the dataset represented in the following box plot.
Important Questions on Measures of Variation
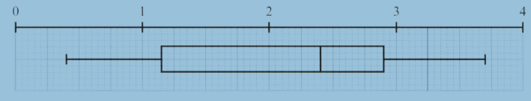
What type of skewness would you expect this set of data to have?
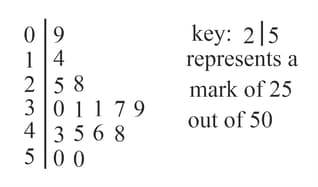
The following stem-and-leaf diagram shows the marks out of obtained by students in a Science test.

Find the range and interquartile range of the marks.
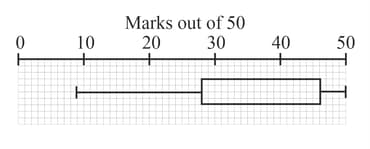
The following stem-and-leaf diagram shows the marks out of obtained by students in a Science test.
Five-point summary for the given data set:
| Minimum | Lower quartile | Median | Upper quartile | Maximum |
The box-and whisker plot for the given data:
For this set of data, express in terms of and
The numbers of fouls made in eight hockey matches and in eight football matches played at the weekend are shown in the following back-to-back stem-and-leaf diagram.
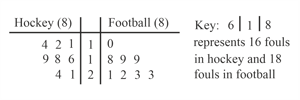
Is it true to say that the numbers of fouls in the two sports are equally varied? Explain your answer.
The numbers of fouls made in eight hockey matches and in eight football matches played at the weekend are shown in the following back-to-back stem-and-leaf diagram.

Draw two box-and-whisker diagrams using the same scales. Write a sentence to compare the numbers of fouls committed in the two sports.
Rishi and Daisy take the same seven tests in Mathematics, and both students' marks improve on successive tests. Their percentage marks are as follows.
Explain why it would not be useful to use the range or the interquartile range alone as measures for comparing the marks of the two students.
Rishi and Daisy take the same seven tests in Mathematics, and both students' marks improve on successive tests. Their percentage marks are as follows.
Name two measures that could be used together to give a meaningful comparison of the two students' marks.
The following table shows the maximum speeds, of some vintage cars.
|
Maximum speed |
No. vintage cars |
Construct a cumulative frequency polygon and a box-and-whisker diagram to illustrate the data.


