
Following are the weights (in ) of boys of a class. Group the data into classes - - , etc.
Important Questions on Frequency Distribution and Bar Graph
The daily earnings of medical stores (in ) are as follows:
| Daily earnings | ||||||||
| Number of stores |
Prepare a frequency distribution table taking equal class size, with intervals - ( not included).
A test was given to a group of students for a job. The time taken (in min) by the students to complete the test was:
Prepare a grouped frequency table for this data taking intervals - - and so on.
Construct a frequency distribution table of class size for the following data:
The pulse rate (per min) of persons was recorded as given below:
Construct a frequency table using class intervals of equal width, one class interval being - .
Study the following bar graph and answer the question:

What is the information given in the double bar graph?
Study the following bar graph and answer the question:
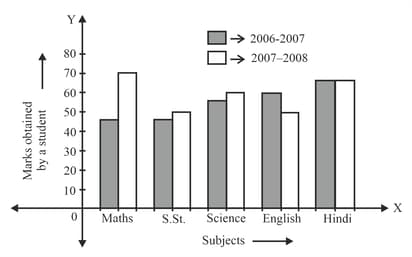
In which subject has the performance improved the most?
Study the following bar graph and answer the questions that follow:

In which subject has the performance deteriorated?
Study the following bar graph and answer the questions that follow:

In which subject is the performance at par?


