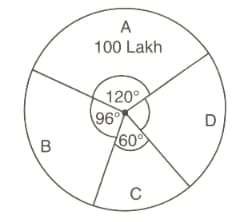
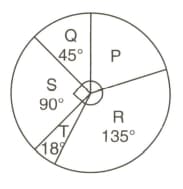
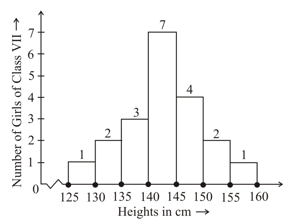
For the histogram given alongside answer the questions that follow.
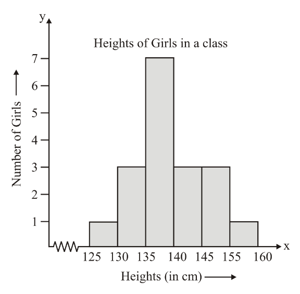
Which group contains the maximum number of girls?

Which group contains the maximum number of girls?

Important Questions on Graphical Representation of Data
For the histogram given alongside answer the questions that follow.
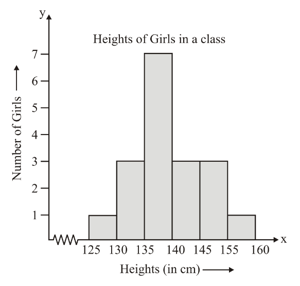
Which groups have the minimum number of girls and how many?
How many girls have a height of or more?
The number of books lent out by a school library each day
| Days | Mon | Tues | Wed | Thurs | Fri |
|---|---|---|---|---|---|
| No of books lent |
The marks obtained by a student in different subjects are shown. Draw a pie diagram showing the information.
| Subject | English | Marathi | Science | Mathematics | Social science | Hindi |
| Marks |
The number of students in a hostel speaking different languages is given below. Represent the data in a pie chart.
| Languages | Hindi | English | Marathi | Tamil | Bengali | Total |
|---|---|---|---|---|---|---|
| Number of students |
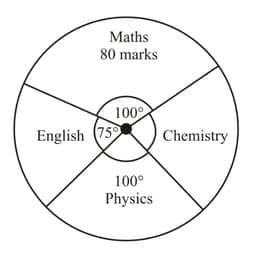
A pie diagram of the marks secured by a student in Maths, English, Physics and Chemistry is shown here. Read the graph and find the marks in Chemistry secured by the student.
A pie chart representing the population of four cities is shown here. Read the pie chart and find the population of the city D in lakhs
