
EASY
JEE Main
IMPORTANT
Earn 100
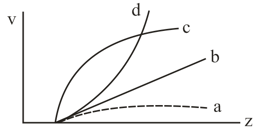
Frequencies of X-rays of different materials are measured. Which one of the graphs in the figure may represent the relation between the frequency and the atomic number .
Important Questions on X-rays
MEDIUM
JEE Main
IMPORTANT
MEDIUM
JEE Main
IMPORTANT
MEDIUM
JEE Main
IMPORTANT
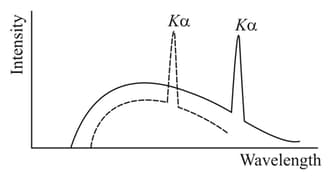
The figure shows the intensity-wavelength relations of rays coming from two different Coolidge tubes. The solid curve represents the relation for the tube in which the potential difference between the target and the filament is and the atomic number of the target material is . These quantities are and for the other tube. Then,
MEDIUM
JEE Main
IMPORTANT
MEDIUM
JEE Main
IMPORTANT
EASY
JEE Main
IMPORTANT
EASY
JEE Main
IMPORTANT
MEDIUM
JEE Main
IMPORTANT
For harder X-ray,


