
From the histogram answer the following question.
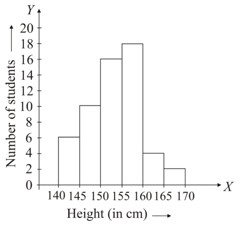
How many students are there in the class?
Important Questions on Introduction to Graphs
Observe the toothpick pattern given below.

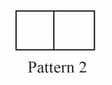
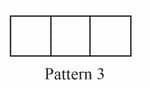
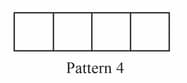
Imagine that this pattern continues. Complete the following table to show the number of toothpicks in the first six terms.
| Pattern | ||||||
| Toothpicks | - | - | - | - |
Make a graph by taking the pattern numbers on the horizontal axis and number of toothpicks on the vertical axis. Make the horizontal axis from to and vertical axis from to .
Make a graph by taking the pattern numbers on the horizontal axis and number of toothpicks on the vertical axis. Make the horizontal axis from to and vertical axis from to .
| Patterns | ||||||
| Toothpicks |
Draw a line graph using a suitable scale to show the annual gross profit of a company for a period of five years.
| Years | |||||
| Gross profit (in ) |
Observe the given circle graph (pie chart) and answer on which head is the expenditure maximum?

Observe the given circle graph (pie chart) and given that the monthly income of the family is . If the amount of savings is , find the value of .
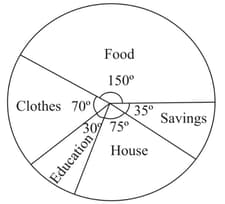
Observe the given circle graph (pie chart) and given that the monthly salary of the family is . If the difference in expenditures on clothes and education is , then find the value of .

The following graph shows the temperature forecast and the actual temperature for each day of a week. On the basis of the graph, answer the following questions.
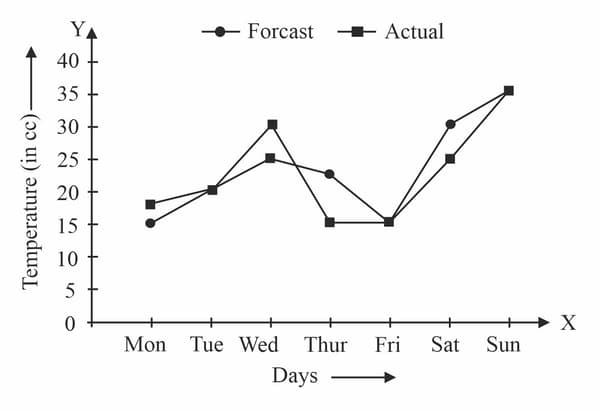
(a) On which days was the forecast temperature same as the actual temperature?
(b) What was the maximum forecast temperature during the week?
(c) What was the minimum forecast temperature during the week?
(d) On which day did the actual temperature differ the most from the forecast temperature?
(e) What is the difference between maximum and minimum actual temperature during the week?
The following graph shows the temperature forecast and the actual temperature for each day of a week. On the basis of the graph, answer the question.
What was the maximum forecast temperature during the week?


