Here are two graphs that represent the motion of two different objects.
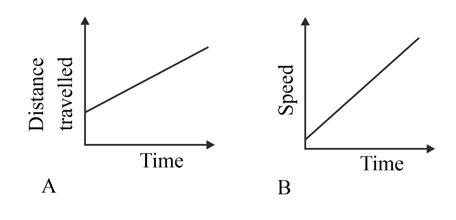
Copy the speed-time graph. Use your graph to explain how you would find the object's acceleration.
Important Questions on Describing Motion
The table shows the difference between vector and scalar quantities.
| Quantity | Description | Examples |
| has magnitude only | ||
| has magnitude and direction |
Copy the table and complete the first column with the word vector and scalar in the correct rows.
The table shows the difference between vector and scalar quantities.
| Quantity | Description | Examples |
| has magnitude only | ||
| has magnitude and direction |
Write the words listed below in the correct spaces in the third column.
speed velocity distance acceleration weight
The graph represents the motion of a bus. It is in two sections, A and B. What can you say about the motion of the bus during these two sections?
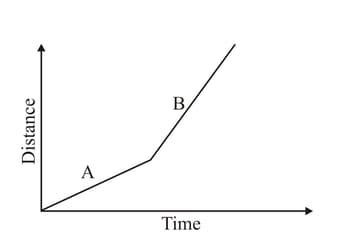
Table shows distance travelled by a car at intervals during a short journey.
| Distance in metre | |||||
| Time in seconds |
Draw a distance time graph to represent this data.
Table shows distance travelled by a car at intervals during a short journey.
| Distance in metre | |||||
| Time in seconds |
Draw a distance time graph. What does the slope of the graph tells about the car speed.
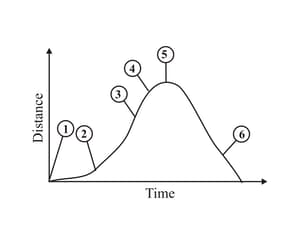
The graph shows distance travelled by a car on a roller-coaster ride, at different times along its trip. It travels along the track, and then returns to its starting position. Study the graph and describe which point describes that THE CAR IS STATIONARY.