
Plot the given points on a graph sheet and check, if the points lie on a straight line. If not, name the shape they form when joined in the given order and .
Important Questions on Introduction to Graphs
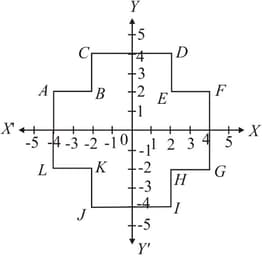
Write the coordinates of the vertices of the following figure.
Draw a line graph from the following data.
Find the value of , when .
Draw a line graph from the following data.
Find the value of , when .
The following table gives the growth chart of a child.
| Height(in ) | |||||
| Age(in year) |
Draw a line graph for the table and find the height of the child at the age of years.
The following table gives the growth chart of a child.
| Height(in cm) | |||||
| Age(in yr) |
Draw a line graph for the table and find how much taller was the child at the age of years than the child of age of years.
The following table gives the growth chart of a child.
| Height(in cm) | |||||
| Age(in yr) |
Draw a line graph for the table and find the two consecutive periods when the child grow more faster.
The graph given below shows the temperatures recorded on a day at different times.
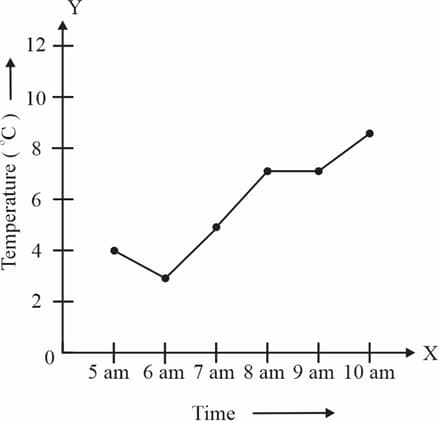
If the temperature at is , then find the value of .
The graph given below shows the temperatures recorded on a day at different times:
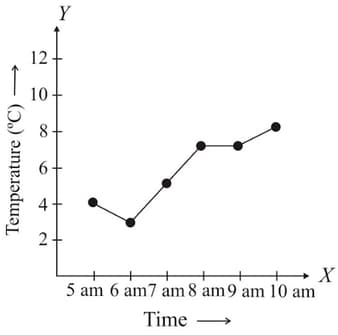
Observe the graph and answer the following question.
At what time is the temperature ?


