
Read the bar graph given and answer the following questions:
What the ratio of expenditure on writing items to that on paper items?
Important Questions on Data Handling
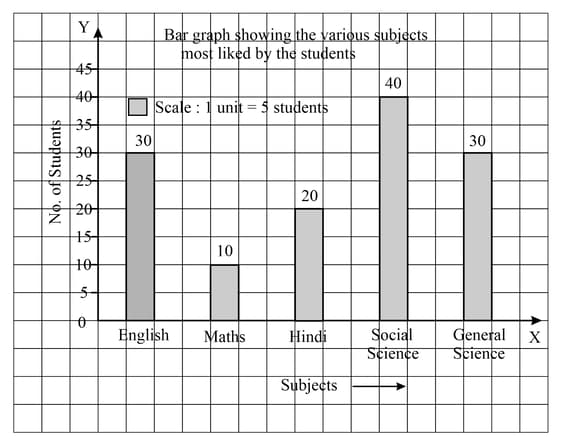
Read the bar graph given and answer the following questions:
Which subject is liked by maximum number of students?

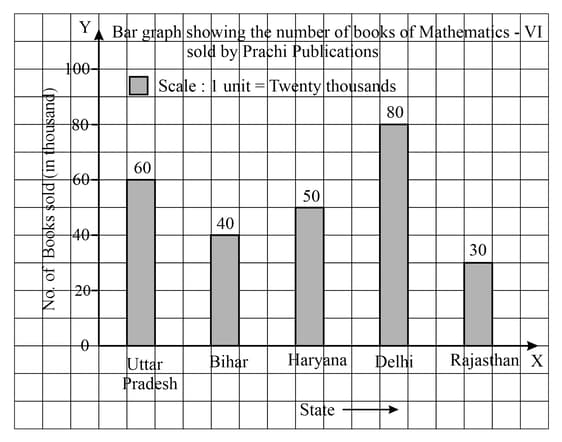
Read the bar graph given and answer the following questions:
What is the information given by the bar graph?

Read the bar graph given and answer the following questions:
How many subjects have been mentioned in the graph?

Read the bar graph given and answer the following questions:
Which subject is liked by least number of students?
Read the bar graph given and answer the following questions:
Is the number of student liking Hindi is double than those liking Maths?

From the following data which shows the population of a country in various years, draw a bar graph.
| Years | |||||||
| Population in millions |
From the following table which shows marks obtained by students in a maths class test, draw a bar graph.
| Marks | |||||||
| Number of students |
Draw a bar graph to represent the following information.
| Years | |||||
| Number of computers sold by a dealer (in thousand) |


