
MEDIUM
8th ICSE
IMPORTANT
Earn 100
Represent the following data by pie chart:
Item of Expenditure
Expenditure
Family A
Family B
Food
Clothing
Rent
Education
Miscellaneous
Total
Important Questions on Data Handling
MEDIUM
8th ICSE
IMPORTANT
The following shows how a student spends his pocket money during the course of a month. Represent it by a pie diagram.
| Item | Food | Entertainment | Other expenditures | Savings |
|---|---|---|---|---|
| Expenditure |
MEDIUM
8th ICSE
IMPORTANT
The following data show the number of students opting for different subjects in a college:
| Subject | English | Maths | Physics | Chemistry | Economics | Commerce |
|---|---|---|---|---|---|---|
| Number of students |
MEDIUM
8th ICSE
IMPORTANT
Draw a pie chart of the areas of continents of the world given in the following table:
| Continents | Asia | Antarctica | Africa | Europe | South America | North America | Australia |
|---|---|---|---|---|---|---|---|
| Area in million sq. km |
MEDIUM
8th ICSE
IMPORTANT
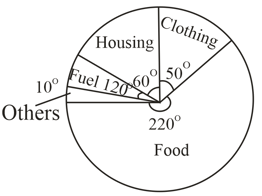
In the given pie chart represents the expenditure of a family on different items. Find the percentage expenditure on different items by reading the pie chart.
MEDIUM
8th ICSE
IMPORTANT
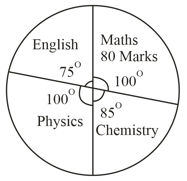
The pie chart gives the marks scored by a student in Maths, English, Physics and Chemistry. Read the diagram and find out the marks scored by the student in chemistry.
EASY
8th ICSE
IMPORTANT
EASY
8th ICSE
IMPORTANT
The range of the data
is
EASY
8th ICSE
IMPORTANT


