
Scientists observe a group of fennec foxes in the Sahara desert. The foxes hunt at night and rest in burrows during the day.
Suggest how these behaviours could help the fennec fox survive in the desert.
Important Questions on Ecology
The graph shows how the human population has changed since 1800.
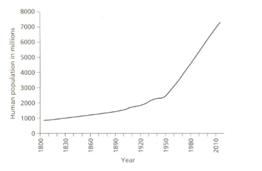
Which two of the following are possible reasons for the changes in the human population size. choose the correct answer.
The graph shows how the estimated population of snowshoe hares and lynx in one part of Canada changed over 20 years.
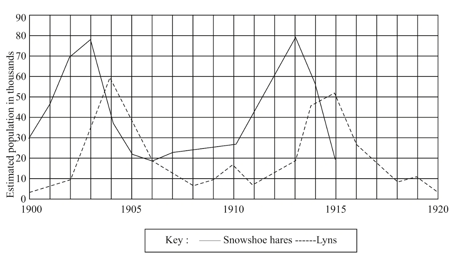
| Year | 1916 | 1917 | 1918 | 1919 | 1920 |
| Estimated number of snowshoe hares (in thousand) | 28 | 16 | 9 | 12 | 5 |
a) Use the data shown in the table to finish plotting the line for the snowshoe hares.
b) Describe how the population of Lynx changed between 1913 and 1917.
c) When the snowshoe hare population increased, the Lynx population also started to increase. Explain why.
Some scientists monitored the population of Cabomba plants in a lake over a period of 6 months.
| Month | January | February | March | April | May | June |
| Number of plants | 765 | 768 | 772 | 483 | 212 | 167 |
Between which months did the number of Cabomba begin to decrease?
Some scientists monitored the population of Cabomba plants in a lake over a period of 6 months.
| Month | January | February | March | April | May | June |
| Number of plants | 765 | 768 | 772 | 483 | 212 | 167 |
List two possible reasons for the decrease in the population of Cabomba plants.


