
Study the following table and answer the questions based on it: The data is (In )
XYZ CO. PVT. LTD
Years
Total sales
Gross profit
Net profit
1990
351.6
155.5
54.2
1991
407.9
134.3
42.6
1992
380.1
149.9
38.9
1993
439.7
160.5
50.3
1994
485.9
203.3
65.8
The percent increase in the gross profit was the largest in which year as compared to the previous one?
Important Questions on Data Interpretation
The table that is given below gives us the information about the North, east, west, south zone wise survey report of the people of a country who consumes coffee.
| Take Coffee | Zone | |||
| North | East | West | South | |
| More than time a day | ||||
| to times a day | ||||
| Twice a week | ||||
| Only once a week | ||||
| Never | ||||
Find the percentage of people from north-west zone who take coffee 'only once a week' (approximately)?
Study the following table and answer the given question. The following table gives zone wise survey report of the people of a country who take coffee.
|
Take coffee |
Zone |
|||
|
|
North |
East |
West |
South |
|
More than three times a day |
|
|
|
|
|
One to three times a day |
|
|
|
|
|
Twice a week |
|
|
|
|
|
Only once a week |
|
|
|
|
|
Never |
|
|
|
|
The total number of people surveyed who take coffee more than times a day to the total number of people who do not take coffee at all is in which of the following ratio ?
Study the following table carefully and answer the questions given below.
Various foodgrains sold by various sold by various farmer at various prices (₹ per )
| Farmer | Rice | corn | Bajra | Paddy | Jowar |
| A | 30 | 22.5 | 22 | 24 | 18 |
| B | 36 | 28 | 24.5 | 25 | 24 |
| C | 40 | 24 | 21 | 26 | 20.5 |
| D | 34.5 | 27.5 | 28 | 25 | 25 |
| E | 36 | 32 | 30 | 28.5 | 27 |
What is the average price per of Bajra sold by all the farmers together?
The following table gives the enrolment in higher secondary schools in . study the table carefully and answer these questions.
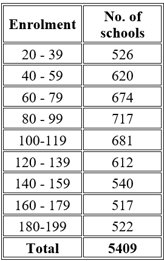
What is the approximate percentage of the least number of schools for the class of enrolment?
|
Enrolment |
Number of schools |
|
|
|
|
|
|
|
|
|
|
|
|
|
|
|
|
|
|
|
|
|
|
|
|
|
|
|
|
Total |
|
What is the approximate percentage of schools, where the enrolment was below ?
Refer the table below and answer the following questions related to the table
| Year | World export | Export of Developed World | Export of Developing world | Exports of Petroleum exporting nations |
| 1989 | 3000 | 2150 | 650 | 160 |
| 1990 | 3450 | 2400 | 740 | 200 |
| 1991 | 3520 | 2500 | 790 | 198 |
| 1992 | 3614 | 2650 | 850 | 210 |
During the period , what percentage of world exports was the exports of the Developing World?
Study the following table and answer the question:
Percentage of marks obtained by six students and in five subjects.
| Subjects | |||||
| Students | English (Out of ) | Maths (Out of ) | Science (Out of ) | Hindi (Out of ) | Social Studies (Out of ) |
The total marks obtained by student in English, Science and Hindi is approximately what per cent of the total marks obtained by student in English, Mathematics, Science and Hindi?
(Correct to one decimal place)


