
The analysis of data in tabular form is done in four ways mainly.
Important Questions on Measurement and Experimentation
The following table shows the amount of rice grown by a farmer in different years:
| Years | |||||||
| Rice grown(in quintals) |
Plot a graph to illustrate this information.
Make a graph by taking the pattern numbers on the horizontal axis and number of toothpicks on the vertical axis. Make the horizontal axis from to and vertical axis from to .
| Patterns | ||||||
| Toothpicks |
Following table represents number of students in a class and their respective average age:
| No. of students | ||||||
| Average age |
Show the above information in graph.
The following chart gives the growth in height in terms of percentage of full height of boys and girls with their respective ages.
Study the table and draw the line graph of the data given below.
| Age (in Year) |
|||||||||||
| Boys | |||||||||||
| Girls |
Now, use the graph to answer the following question:
Who grows faster at puberty ( years to years of age)
The following table shows the number of patients discharged from a hospital with HIV diagnosis in different years:
| Years: | |||||
| Number of patients: |
Represent the information by a graph.
The following table shows the monthly tourist arrivals from January to June:
| Months | January | February | March | April | May | June |
| Number of Tourists |
Draw a histogram from the above table and find the difference between the highest arrival and the lowest arrival of tourists from January to June.
The sales of a shopkeeper for eight days of a month in any year is given below:
| Date | ||||||||
| Sales(in ) |
Draw the line graph depicting the above data.
The following table shows the percentage of students who dropped out of school after completing high school
| Year | |||||||
| Percentage of students who dropped out of school |
Study the above table carefully and draw a line graph to depict it.
The following chart gives the growth in height in terms of percentage of full height of boys and girls with their respective ages.
Study the table and draw the line graph of the data given below.
| Age (in Year) |
|||||||||||
| Boys | |||||||||||
| Girls |
Now, use the graph to answer the following question:
In which year both boys and the girls achieve their maximum height?
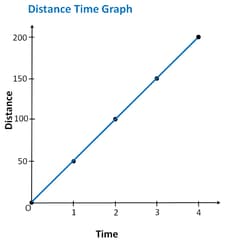
The slope of the line in distance-time graph which is shown below is
The following table shows the monthly tourist arrivals from January to June.
| Months | January | February | March | April | May | June |
| Number of Tourists |
Draw a histogram from the above table and find the total number of tourists in six months.


