Experimentation
Experimentation: Overview
This topic sheds light on the experimentation. We will understand the concept of doing experiments and finding the conclusions. It also explains the principles of experimentation that one must remember.
Important Questions on Experimentation
If the data in the table given to you is about the number of people in different nations, the classification is known as :
If the ages of different people and their names are given to you, will you be able to make a table out of that? If yes, what is the name of such a classification?
"When data is given in a table, it can be analysed in different manners". Explain.
The analysis of data in tabular form is done in four ways mainly.
What do you mean by tabular representation of data?
If you are drawing a graph between the distance travelled with time taken by a car to travel between five cities. The cities are . Which of the following would be the most suitable scale to draw this graph?
When we are drawing two graphs, is it necessary that the scales of both graphs should be the same? Explain.
When we draw two graphs, whatever be the situation, the scale of the graph should be the same.
To measure or quantify objects, we use a scale in a graph.
What is scale used in graphs?
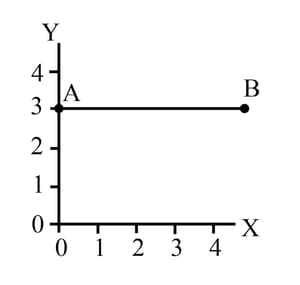
How do you find the slope of a straight line?
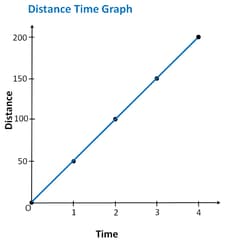
What is the slope of the straight line in the given graph?
The Slope of the velocity-time graph gives the displacement.
The Slope of the displacement-time graph shows
Define a slope of a straight line.
A student measures the length of a piece of a pencil by meter ruler, vernier calipers and screw gauge. Here, the _____ is the device with the highest accuracy and precision.
The screw advances on the main scale in six rotations. How many divisions are required on the head scale to measure accuracy up to ?
The maximum displacement of a simple pendulum from its mean position is called amplitude.
The slope of the line in distance-time graph which is shown below is