
The bar graph given below represents the total population and male population (in thousands) of a city, during the period of 2013 to 2016.
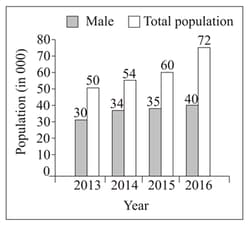
In 2014 the female population is what percent of the total population?
Important Questions on Data Interpretation
Study the following graph carefully to answer the question given below.
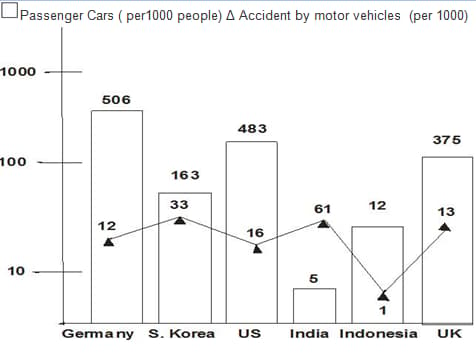
What is the ratio of total passenger cars per thousand and the total motor vehicle accident per thousand of all the given countries?
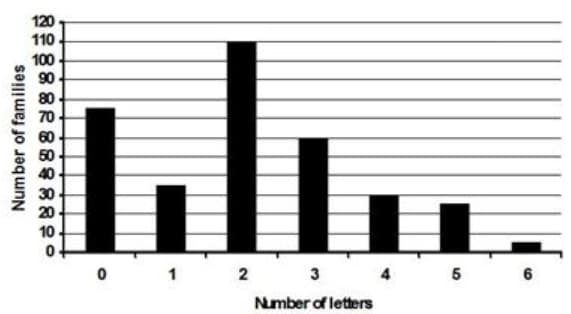
The difference of 2 numbers of letters received family and 3 numbers of letter recieved family is -
A cosmetic company provides five different products. The sales of these five products (in lakh number of packs) during 1995 and 2000 are shown in the following bar graph.
Read the following question regarding sales (in lakh number of packs) of five different products of Cosmetic Company during 1995 and 2000.
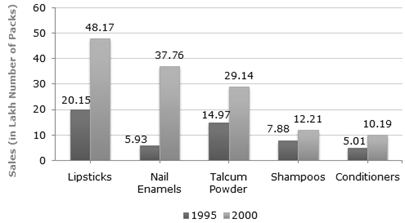
The sales of lipsticks in 2000 was by what percent more than the sales of nail enamels in 2000? (rounded off to nearest integer)
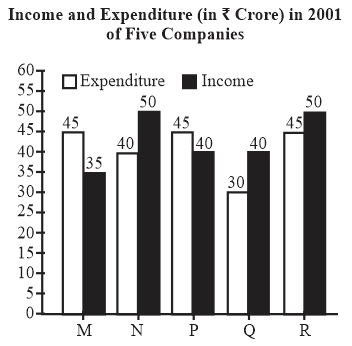
Study the following bar graph and answer the following question:
What is the percentage of profit/loss of companies M and N together?

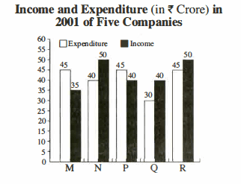
If the income of company Q in was more than and the company had earned a profit of in , then its expenditure in (in crores) is
The following graph represents the number of students who passed the CAT exam or the XAT exam or the CET exam or None of these exams.
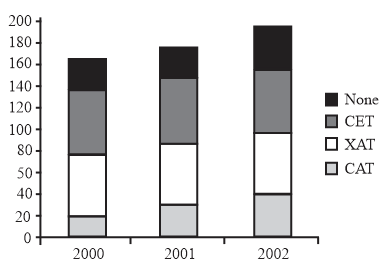
What was the percentage of students who succeeded in at least one of the three exams in ?
Following bar graph shows the ratio of export to import of two companies A and B during the period of 2005 - 2010.
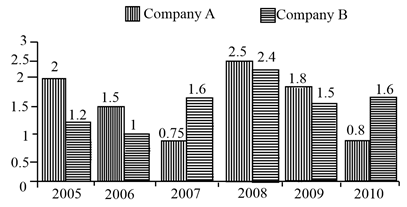
If export of Company A in 2005 and 2007 together is Rs 80 lakhs, then what is the total import of A in 2005 and 2007 together?


