
The diagram below shows a food web.
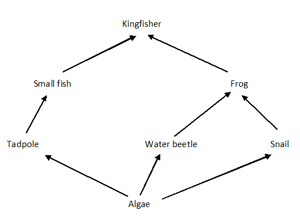
a) Use the food web to draw a food chain that has four trophic levels.
b) All the frogs in the food web die of a disease. Explain what will happen to the size of the population of snails.
Important Questions on Ecology
Complete the table to show what resources organisms need to survive. Add one cross (X) to each row. The first row has been done for you.
| Resource | Plants | Animals | Both plants and animals |
| Sunlight | X | ||
| Water | |||
| A source of food | |||
| Carbon dioxide |
The barrel cactus grows in the desert. The plant is adapted to live in the desert. Explain how each adaptation helps the barrel cactus to survive.

Large swollen stem: _____
The barrel cactus grows in the desert. The plant is adapted to live in the desert. Explain how each adaptation helps the barrel cactus to survive.
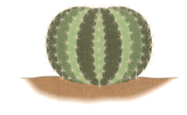
Thick spines rather than leaves: _____
Scientists observe a group of fennec foxes in the Sahara desert. The foxes hunt at night and rest in burrows during the day.
Suggest how these behaviours could help the fennec fox survive in the desert.


