The diagram shows magnetic field lines. We move from above to below and back.
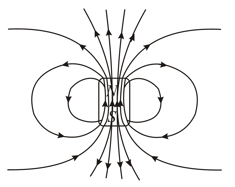
Below shows the graph of variation of magnetic flux with time.
Important Questions on Electromagnetic Induction
Match the following:
| (i) | magnetic flux | (a) | tesla |
| (ii) | magnetic flux density | (b) | weber |
| (iii) | relative permeability | (c) | no unit |
| (iv) | magnetic field intensity | (d) | amper/meter |
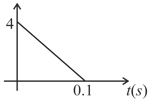
When magnetic flux through a coil is changed, the variation of induced current in the coil with time is as shown in graph. If resistance of coil is , then the total change in flux of coil will be-
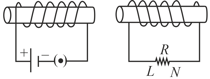
Two co-axial solenoids shown in figure. If key of primary suddenly opened then direction of instantaneous induced current in resistance ' ' which connected in secondary :-
As a result of change in the magnetic flux linked to the closed loop shown in the figure, an e.m.f. . volt is induced in the loop. The work done (joules) in taking a charge coulomb once along the loop is :-
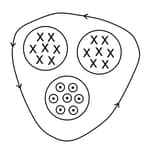
Figure shows three regions of magnetic field each of area and in each region magnitude of magnetic field decreases at a constant rate . If is induced electric field, then value of line integral along the given loop is equal to,