
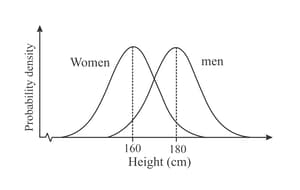
The distributions of the heights of women and of men both produce normal curves, as shown. The mean height of the women is and the mean height of the men is The heights of these women and men are now combined to form a new set of data. Assuming that the combined heights also produce a normal curve, copy the graph opposite and sketch onto it the curve for the combined heights of the women and men.
Important Questions on The Normal Distribution
Probability distributions for the quantity of apple juice in apple juice tins and for the quantity of peach juice in peach juice tins are both represented by normal curves.
The mean quantity of apple juice is with variance and the mean quantity of peach juice is with standard deviation 
Copy the diagram and sketch onto it the normal curve for the quantity of peach juice in the peach juice tins.
Probability distributions for the quantity of apple juice in apple juice tins and for the quantity of peach juice in peach juice tins are both represented by normal curves.
The mean quantity of apple juice is with variance and the mean quantity of peach juice is with standard deviation 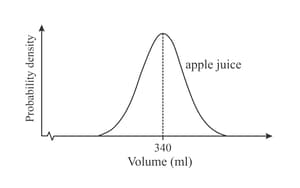
Describe the curves' differences and similarities.
On a single diagram, sketch and label these two normal curves.
Describe the curves' differences and similarities.
The values in two datasets, whose probability distributions are both normal curves, are summarised by the following totals:
and
and
Show that the centre of the curve for is located to the right of the centre of the curve for
The values in two datasets, whose probability distributions are both normal curves, are summarised by the following totals:
and
and
On the same diagram, sketch a normal curve for each dataset.
Given that find the following probability correct to significant figures.
Given that find the following probability correct to significant figures.


