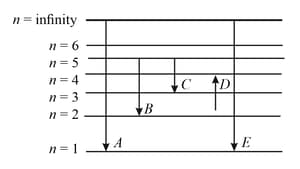
The energy levels of the hydrogen spectrum is shown in the figure. There are some transitions ,, , and . Transition , and respectively represent
Important Questions on Atomic Physics
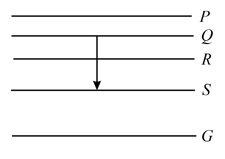
In the given figure and respectively represent
 ,
,
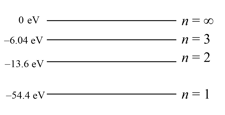
The energy level diagram for a hydrogen-like atom is shown in the figure. The radius of its first Bohr orbit is
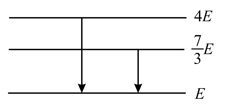
The following diagram indicates the energy levels of a certain atom when the system moves from level to . A photon of wavelength is emitted. The wavelength of photon produced during its transition from level to is . The ratio will be
Energy levels , , of a certain atom corresponding to increasing values of energy, i.e., . If , and are the wavelengths of radiations corresponding to the transitions to , to and to respectively, which of the following statements is correct
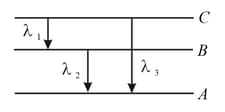
Figure shows the energy levels , , , and of an atom, where is the ground state. A red line in the emission spectrum of the atom can be obtained by an energy level change from to . A blue line can be obtained by the following energy level change