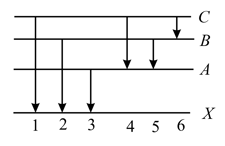
The figure indicates the energy level diagram of an atom and the origin of six spectral lines in emission (e.g. line no. arises from the transition from level to ). The following spectral lines will also occur in the absorption spectrum
Important Questions on Atomic Physics
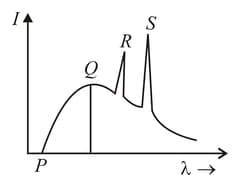
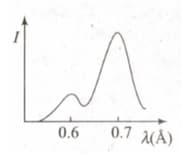
The figure represents the observed intensity of -rays emitted by an -ray tube as a function of wavelength. The sharp peaks and denote
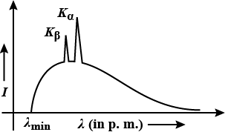
If the potential difference between the anode and the cathode of the -ray tube increases
In the diagram, a graph between the intensity of -rays emitted by a molybdenum target and the wavelength is shown, when electrons of are incident on the target. In the graph, one peak is of line and the other peak is of line.
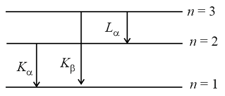
Let and denote the wavelengths of the -rays of the and lines in the characteristic -rays for a metal