
The following data shows India's total population (in millions) from to
Year of Census
Population (in millions)
Represent the above data by a bar graph.
Important Questions on Data Handling II Bar Graphs and Histograms
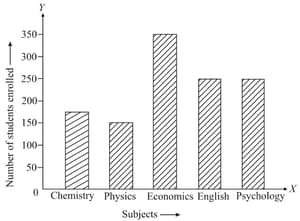
Read the bar graph given in figure and answer the given question.

Which course has the most students enrolled in it?
How many times the enrolment in Economics is more than the enrolment in Chemistry?( write the final answer in numerals)
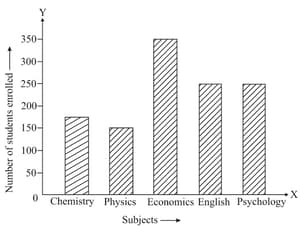
Read the bar graph given in figure and answer the given question.

How many students are enrolled in the course with most students?
Observe the bar graph given below and answer the question.
How many more students are enrolled for Economics than for Physics?
Name the two subjects for which equal number of students are enrolled.
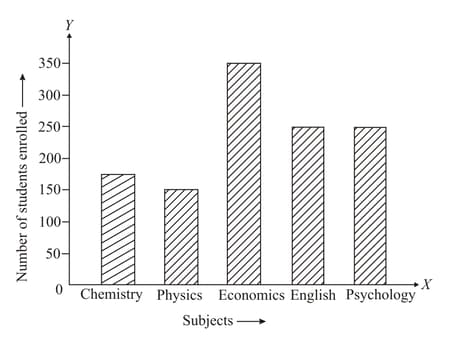
What is the ratio of the number of students enrolled for Chemistry to the number of students enrolled for Physics?

Figure is a bar graph showing the number of students in different clubs of the school:
Read the bar graph carefully and answer the given question.
What information does the bar graph give?
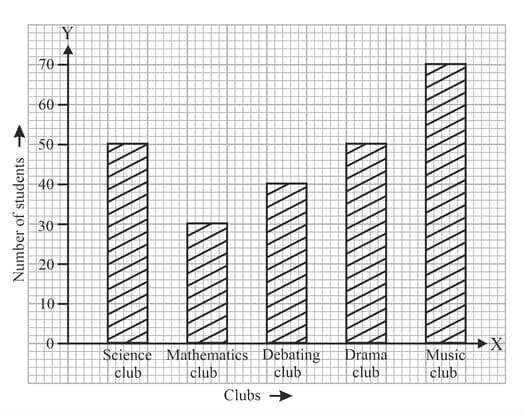
The figure is a bar graph showing the number of students in different clubs of the school:
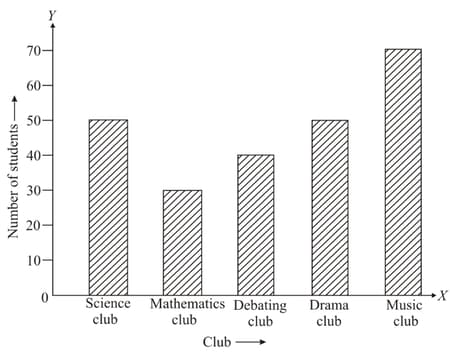
Which club has the least number of members? (Science / Mathematics / Debating / Drama / Music)


