
The following histogram shows the frequency distribution of the ages of teachers in a school:
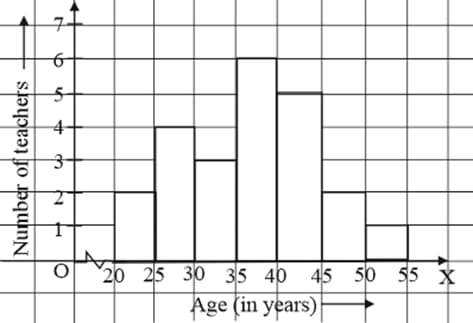
What is the size of the classes?
Important Questions on Data Handling-II (Graphical Representation of Data as Histograms)
The following histogram shows the frequency distribution f the ages of teachers in a school:
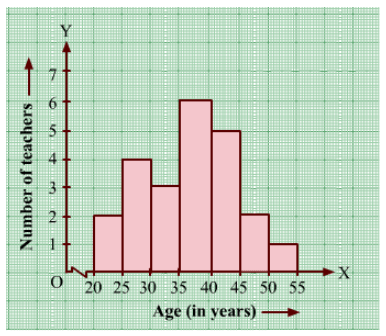
What are the class marks of the classes?
The weekly wages (in Rs.) of workers in a factory are given:
Mark a frequency table with intervals as , and so on, using tally marks. Also, draw a histogram and answer the following questions:
Which group has the maximum number of workers?
The weekly wages (in Rs.) of workers in a factory are given:
Mark a frequency table with intervals as , and so on, using tally marks. Also, draw a histogram and answer the following questions:
How many workers earn and more?
The weekly wages (in Rs.) of workers in a factory are given:
Make a frequency table with intervals as , and so on, using tally marks. Also, draw a histogram and answer the following questions:
How many workers earn less than Rs ?


