
The following histogram shows the number of literate females in the age group of to years in a town:
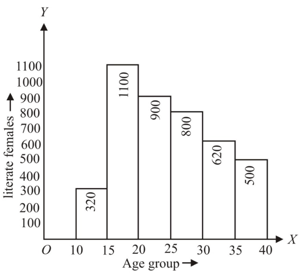
In which age group literate females are the least?
Important Questions on Data Handling-II (Graphical Representation of Data as Histograms)
The following histogram shows the monthly wages (in ) of workers in a factory:
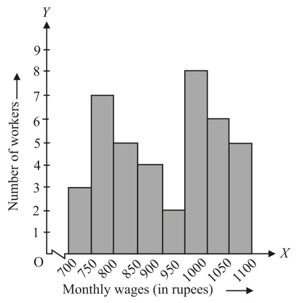
In which wage-group the largest number of workers are being kept? What is their number?
The following histogram shows the monthly wages (in ) of workers in a factory:
What wages are the least number of workers getting? What is the number of such workers?
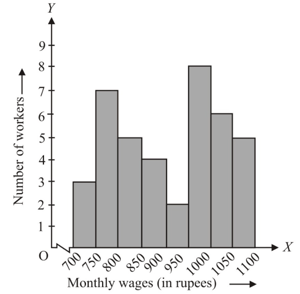
The following histogram shows the monthly wages (in) of workers in a factory:
What is the total number of workers?
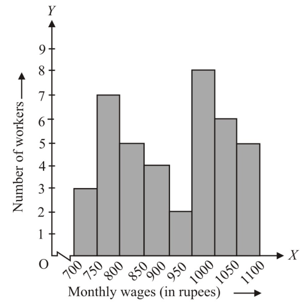
The following histogram shows the monthly wages (in ) of workers in a factory:
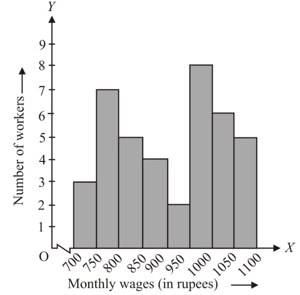
What is the factory size?
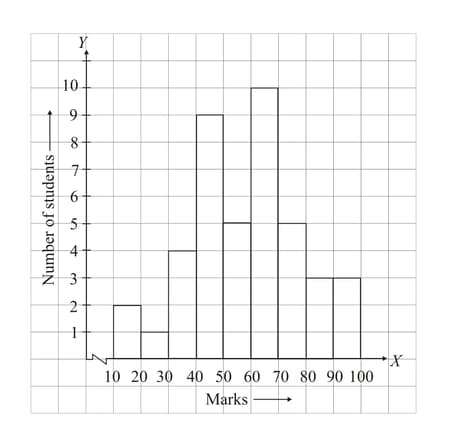
Below is the histogram depicting marks obtained by students of a class. Find the number of students getting the highest marks.
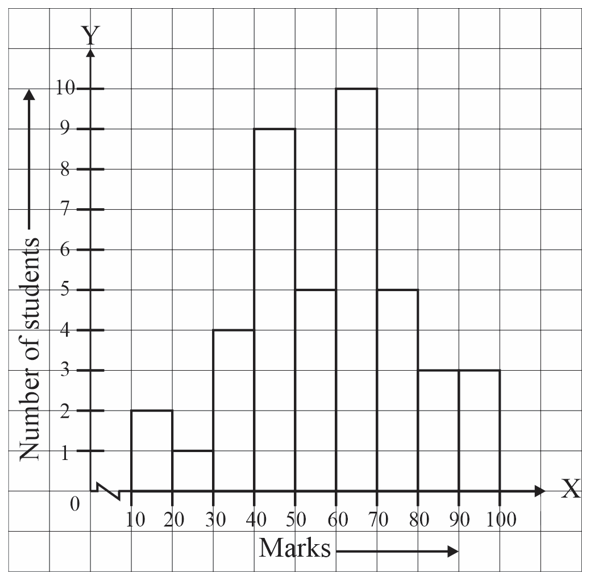
Below is the histogram depicting marks obtained by students of a class:
What is the class size?
The following histogram shows the frequency distribution f the ages of teachers in a school:
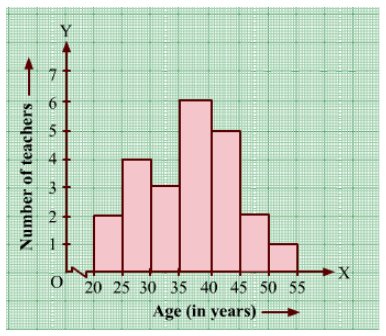
What is the number of eldest and youngest teachers in the school?
The following histogram shows the frequency distribution f the ages of teachers in a school:

Which age group teachers are more in the school and which least?


