
The following stem-and-leaf diagram shows eight randomly selected numbers between and .
Given that and that the sum of the eight numbers correct to the nearest integer is , find the value of and .
Important Questions on Representation of Data
Eighty people downloaded a particular application and recorded the time taken for the download to complete. The times are given in the following table.
| Download time (min) | ||||
| No. downloads |
Find the number of downloads that completed in to minutes.
Eighty people downloaded a particular application and recorded the time taken for the download to complete. The times are given in the following table.
| Download time (min) | ||||
| No. downloads |
Find the number of downloads that completed in to minutes.
On a histogram, the download times from to minutes are represented by a column of height . Find the height of the column that represents the download times of to minutes.
A histogram is drawn with three columns whose widths are in the ratio . The frequency densities of these classes are in the ratio , respectively.
Given that the total frequency of the data is , find the frequency of each class.
A histogram is drawn with three columns whose widths are in the ratio . The frequency densities of these classes are in the ratio , respectively.
Given that the total frequency of the data is , find the frequency of each class.
The classes with the two highest frequencies are to be merged and a new histogram drawn. Given that the height of the column representing the merged classes is to be , find the correct height for the remaining column.A histogram is drawn with three columns whose widths are in the ratio . The frequency densities of these classes are in the ratio , respectively.
Given that the total frequency of the data is , find the frequency of each class.
The classes with the two highest frequencies are to be merged and a new histogram drawn. Given that the height of the column representing the merged classes is to be , find the correct height for the remaining column.Explain what problems you would encounter if asked to construct a histogram in which the classes with the two lowest frequencies are to be merged.
The histograms below illustrate the number of hours of sunshine during August in two regions, and . Neither region had more than hours of sunshine per day.
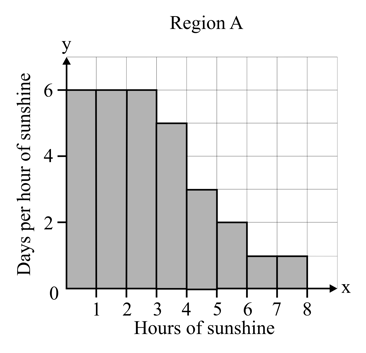

Explain how you know that some information for one of the regions has been omitted.
The histograms below illustrate the number of hours of sunshine during August in two regions, $A$ and $B$. Neither region had more than 8 hours of sunshine per day.

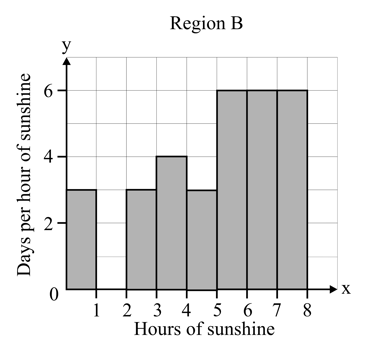
After studying the histograms, two students make the following statements.
- Bindu: There was more sunshine in region A than in region during the first weeks of August.
- Janet: In August there was less sunshine in region than in region .
Discuss these statements and decide whether or not you agree with each of them.In each case, explain your reasoning.
A hotel has rooms. The table summarises information about the number of rooms occupied each day for a period of days.
| Number of rooms occupied | ||||||
| Frequency |
Draw a cumulative frequency graph on graph paper to illustrate this information.


