
The following stem-and-leaf diagram shows the marks out of obtained by students in a Science test.
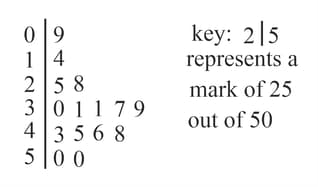
Find the range and interquartile range of the marks.
Important Questions on Measures of Variation
A company manufactures right-angled brackets for use in the construction industry. A sample of brackets are measured, and the number of degrees by which their angles deviate from a right angle are summarised in the following table.
| Deviation from | No. brackets |
A bracket is considered unsuitable for use if its angle deviates from a right angle by more than Estimate what percentage of this sample is unsuitable for use, giving your answer correct to the nearest integer.
The following table shows the cumulative frequencies for values of
Without drawing a cumulative frequency graph, find:
the percentile.
Find the mean and the standard deviation for these sets of numbers.
Find the mean and the standard deviation for these sets of numbers.
Last term Abraham sat three tests in each of his science subjects. His raw percentage marks for the tests, in the order they were completed, are listed.
| Biology | Chemistry | Physics |
Calculate the variance of Abraham's marks in each of the three subjects.
Last term Abraham sat three tests in each of his science subjects. His raw percentage marks for the tests, in the order they were completed, are listed.
| Biology | Chemistry | Physics |
(a) Calculate the variance of Abraham's marks in each of the three subjects.
Comment on the three values obtained in part Do the same comments apply to Abraham's mean mark for the tests in the three subjects? Justify your answer.
The times spent, in minutes, by girls and by boys on an assignment are detailed in the following table.
| Time spent (min) | ||||
| No. girls | ||||
| No. boys |
For the boys and for the girls, calculate estimates of the mean and standard deviation.
The times spent, in minutes, by girls and by boys on an assignment are detailed in the following table.
| Time spent (min) | ||||
| No. girls | ||||
| No. boys |
It is required to make a comparison between the times spent by the two groups.
What do the means tell us about the times spent?


