
The given double bar graph shows the sale of mobile phones and cars from to .
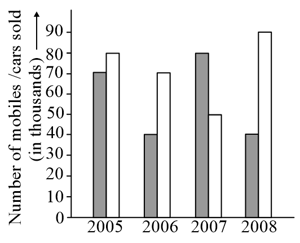
(i) Find the ratio of the total number of
mobile phones sold in and
to the total number of cars sold in
and
(ii) What is the average number of cars
sold from to ?
mobile phones sold in and
to the total number of cars sold in
and
(ii) What is the average number of cars
sold from to ?
Important Questions on Data Handling
Which of the following is false?
Which of the following is true?
Average of the marks in maths of 40 students in a class was 74. The mean of marks for boys was 72, while their number was 21. The mean of marks of girls in the class was
One of letter keys on a type writer is pressed. What is the probability that the key prints a letter other than a vowel?
Find the arithmetic mean between .
In a bag, there are seven cards numbered to . A card is picked at random. What is the probability of picking not a prime number card?
The average of five numbers is . If mean of three of these numbers is , what is the mean of the other two numbers?
Match the following:
| List-I |
List-II |
|
(P) Value which occurs most often in a set of data is called |
(1) Frequency |
|
(Q) The middle value when the set of data is arranged in ascending or descending order is called |
(2) Range |
|
(R) Difference between the highest and lowest values of a set of data is called |
(3) Mode
|
| (S) The number of times a particular observation occurs is called | (4) Median |


