
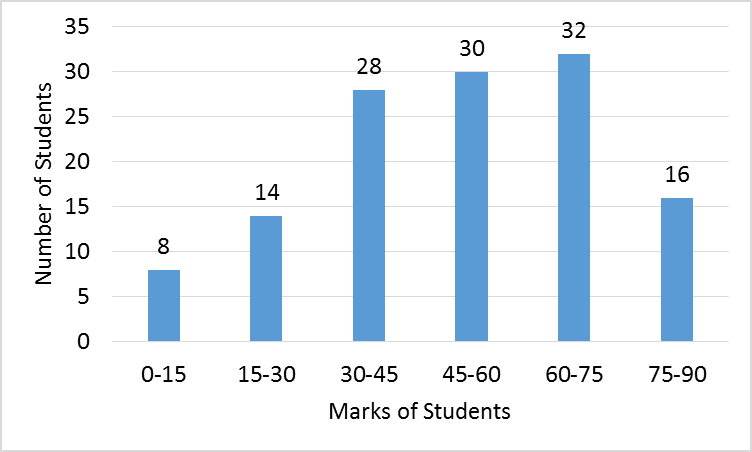
The given histogram represents the marks obtained by students. Read the graph and answer the question that follows.
 .
.
What percent of students got marks less than
.Important Questions on Data Interpretation
Study the following line graph and answer the questions.
Exports from three companies over the years (in Pesetas).
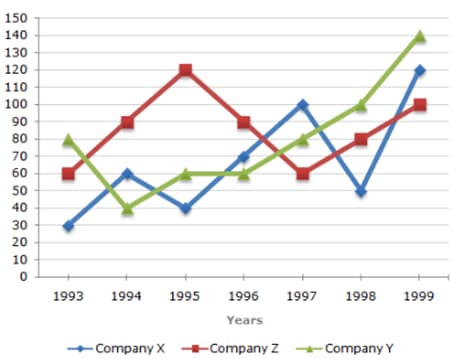
For which of the following pairs of years the total exports from the three companies together are equal?
The number of hours for which students of a particular class watched television during holidays is shown through the graph given below:
See the graph given and answer the following questions
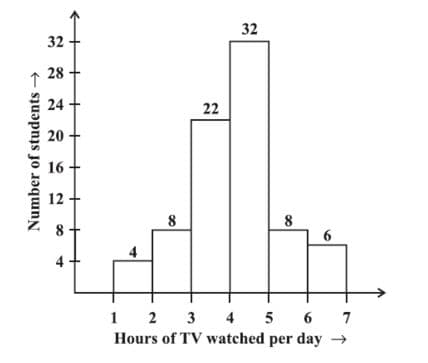
How many students spent less than in TV watching ?
Study the following graph and answer the questions that follow:No. of students (in thousand) who opted for three different specialisations during the given five years in a university
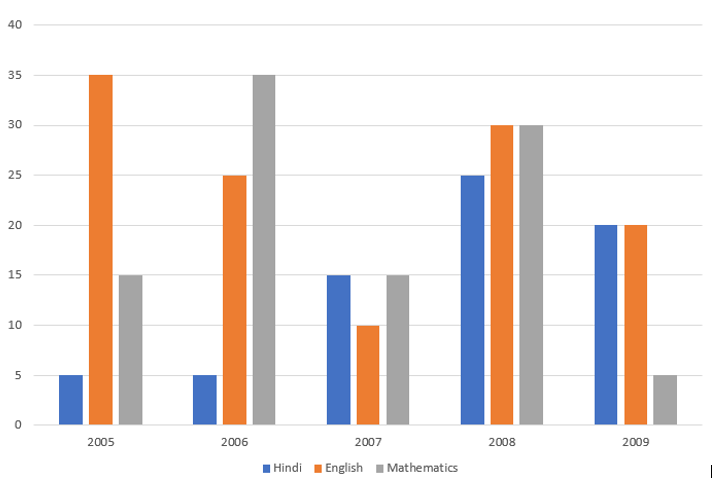
What is the total number of students who opted for Hindi and Mathematics in the years together?
Study the bar chart and answer the question below:
The bar graph provided below gives the data of the production of paper (in lakh tons) by three different companies over the years.
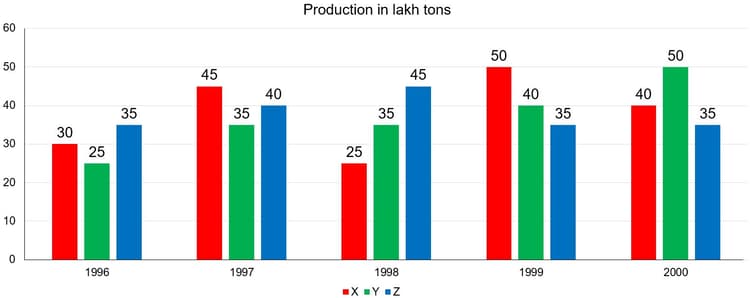
The average production for five years was maximum for which Company?
Read the following graph carefully and answer the question given below.
The foreign exchange reserves of a country (in million US ) from to .
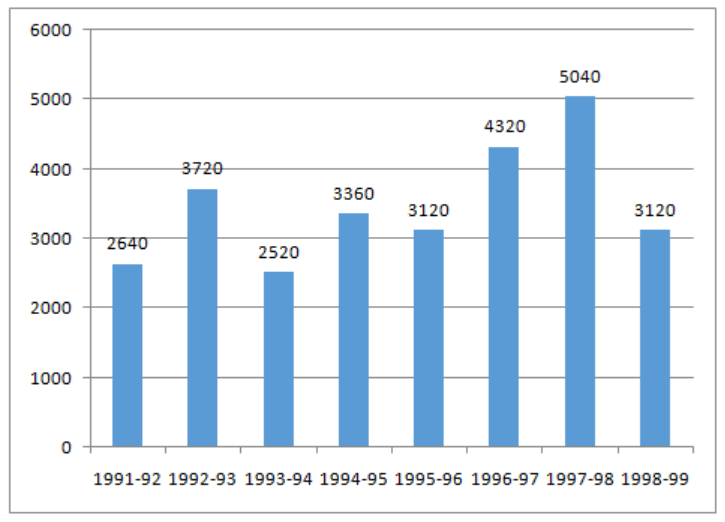
Ratio of the sum of foreign exchange during the years , , to that during the years , , is:
The given graph shows the weights of students in a school on a particular day.
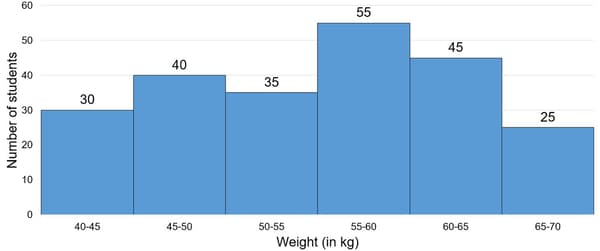
The number of students weighing less than is what percent less than the number of students weighing or more?
The given graph shows the marks obtained by the students in an examination.
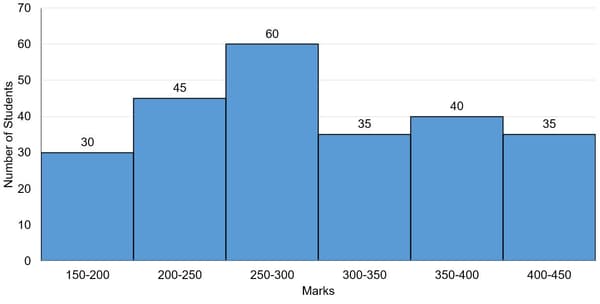
The numbers of students who obtained less than marks is what percent more than the number of students who obtained or more marks?
Study the graph and answer the question,
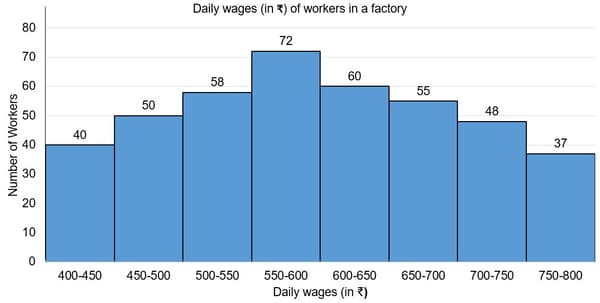
The number of workers in the factory whose daily wages are or more but less than is:


