The given pie chart shows the percentages of blood types for a group of people.
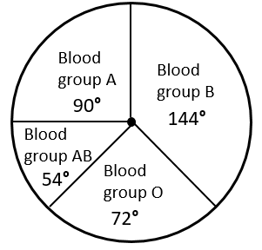
How many people in this group do not have blood types ?
Important Questions on Data Handling
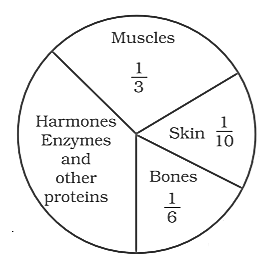
The following pie chart represents the distribution of proteins in parts of a human body.
What is the central angle of the sector (in the below pie chart) representing hormones enzymes and other proteins.
Given below is a pie chart showing the time spend by a group of children in different games. Observe it and answer the questions that follow.
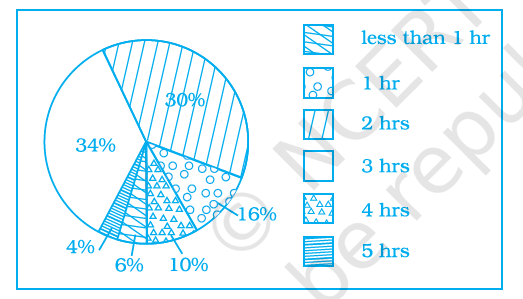
How many children spend more than hours in playing games?
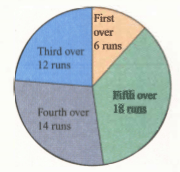
The given piegraph shows the runs scored in the first five overs in a cricket match.
Answer the following question based on the given pie graph:
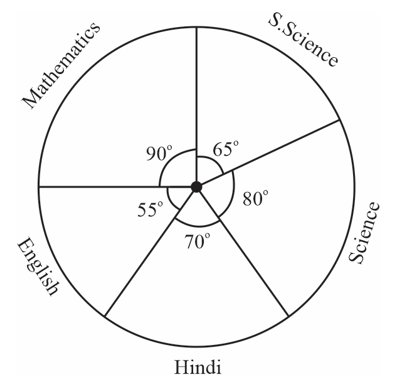
In Figure, the pie-chart shows the marks obtained by a student in various subjects. If the student scored marks in mathematics, find the total marks in all the subjects. Also, find his score in individual subjects.
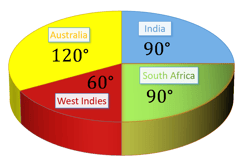
The Supply Chain department of a particular clothing company has reproduced their supplies in its different branches in it Annual Report as given below:
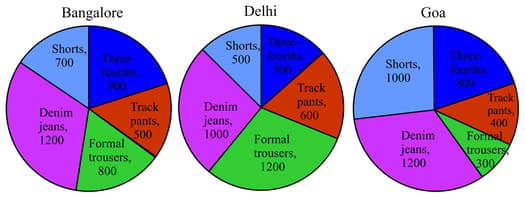
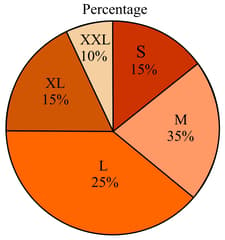
Their supply with respect to various clothing sizes are uniform in all the three branches, and has been given by the chart:
A shareholder of this company is now trying to figure out the following data from the above charts:
Number of Medium sized "Three-fourths" supplied to Goa, Number of Small sized "Denim Jeans" supplied to Bangalore and Number of Large sized "Shorts" supplied to Delhi.
What will be the correct combination of the values obtained?
The below pie chart shows the share of the total number of matches played by the four Cricket teams during the period :
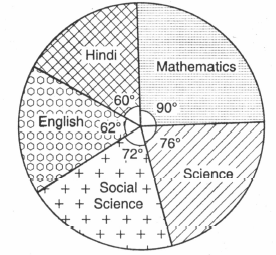
The adjoining pie chart gives the marks scored in an examination by a student in Hindi, English, Mathematics, Social Science and Science. If the total marks obtained by the student is . In which subject did the student score marks?